11.4 Specialised Outputs
Specialised outputs include:
- Receptors: records the flood level and time at one or more gauge(s) when the receptor is inundated above the specified trigger level, see Section 11.4.1.
- Evacuation Routes: provides additional information (e.g. first point of closure) along routes, see Section 11.4.2.
11.4.1 Receptors
Read GIS Objects RECORD GAUGE DATA records the flood level and simulation time at one or more gauge(s) when receptors are first inundated above their trigger inundation levels (e.g. floor levels). The output is tracked at every 2D timestep. Read GIS Receptors can be used as an alias to Read GIS Objects. Level output associates a flood level at one or more gauges with the time of first inundation at properties, buildings, or other areas of interest within the modelled extent.
When the water level at the property reaches a user-defined trigger inundation level, the gauge height and simulation time are recorded and tagged to the receptor. This is particularly useful for flood warning and forecasting studies where property specific information on the likelihood of a property being inundated for a given gauge height can be generated. An example of translating gauge data information to catchment receptors can be found in the Output Options Example Model Dataset on the TUFLOW Wiki.
Gauges are defined as a point within a 2d_po GIS layer with type “G_” (see Section 11.3.2 and Table 11.9). The levels from all gauges are recorded at each receptor once inundated.
Receptors must be GIS point and/or polygon objects located in one or more GIS layers nominally prefixed by 2d_obj or 2d_rec. Each object within the layer represents a receptor, property or other object of interest. For information on the attributes of the GIS layer see the Read GIS Objects .tgc command. The command also includes options to set the Zpt elevations to the receptor level or the first attribute in the layer (for example, to set the Zpts to the floor level of the buildings), or to alternatively use the existing ZC elevations.
Once simulated, a GIS layer is written to the location as specified using the .tcf command Output Folder, and has a _GDO extension standing for Gauge Data Output. The layer contains point objects (for regions the centroid is used). The attribute data for the layer are described in Table 11.13. Figure 11.6 shows an example of how the output GIS layers may be used to illustrate the flooding of properties in relation to the water level at a gauge.
As well as outputting the water levels at gauge objects (as described above), the water levels at all point reporting locations and flows for all line reporting locations are also recorded. The reporting locations can be 1D and/or 2D locations. See Section 11.3.3 for a full description of the reporting location functionality. For example, flows past a gauge can be recorded, including combined flows from 1D channels and the 2D domain(s).
| GIS Attribute | Description |
|---|---|
| <gauge_1> | The water level in metres or feet above datum at <gauge_1> (as defined in a 2d_po layer) when the water level first reaches the Trigger_Level at the property/building/object. |
| <gauge_n>… | If a second, third, fourth… gauge exists, the water level in metres above datum at each gauge. |
| Time | The simulation time in hours when the water level at the receptor first reaches the Trigger_Level. |
| Trigger_Level | The trigger inundation level at the receptor. The level will be either the first attribute in the GIS layer (typically either the ground level of the property or the floor level of a building), or the lowest ZC value within the property or building polygon if the “USE ZC” option is specified (i.e. Read GIS Objects USE ZC). |
| Use_ZC | “Y” if the ZC 2D cell elevation was used for the Trigger_Level; “N” if not. |
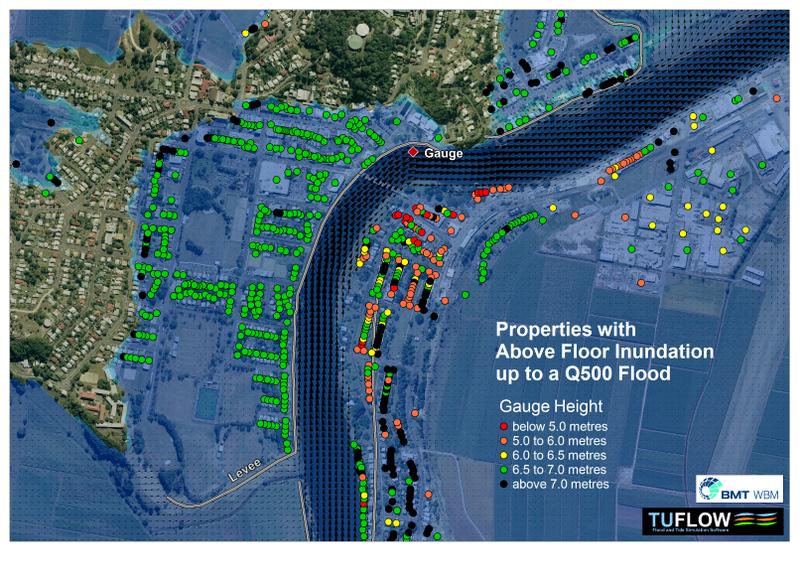
Figure 11.6: Example Use of Gauge Data Output Layer
11.4.2 Evacuation Routes
Evacuation routes can be specified to output information relating to:
- Evacuation route suitability;
- Warning times;
- Risks;
- Degree of route inundation; and
- Duration of inundation.
The .tgc Read GIS Z Shape Route is used to define the routes and, by default, also adjust the Zpt elevations along the route using the standard Z Shape options. The 2d_zshr layer is the same as a 2d_zsh layer, but with three additional attributes, as shown in Table 11.14. Note, if using the TUFLOW HPC SGS functionality (Section 7.3.3, the cells/faces selected by this command are assumed flat (e.g. the traditional sampling approach using a single cell centre/face elevation).
The commands Set Route Cut Off Values and Set Route Cut Off Type can be used in the .tcf and/or .tgc files. If used in the .tcf file, this sets the default values for the 2d_zshr Cut_Off_Type and Cut_Off_Values attributes if these attributes are left blank. The default values can be changed between different Read GIS Z Shape Route commands in the .tgc file by repeat usage of the same commands.
The _RCP output layer is a GIS layer of points showing where a route’s cut off value(s) were first exceeded (e.g. first point of closure). The layer contains the attributes as shown in Table 11.15.
The Route Categories over time is available as a map output and is written when adding RC to the .tcf command Map Output Data Types. This output file is only produced when using TUFLOW Classic. This file can be used to view and animate the route category values.
A range of evacuation route examples are available in the Output Options Example Model Dataset on the TUFLOW Wiki.
| No | Default GIS Attribute Name | Description | Type |
|---|---|---|---|
| 1 | Z | Unless the BRIDGE Shape_Options is specified (see below), the Z Shape lines adjust the Zpts as described in Table 7.6 for the same attribute. | Float |
| 2 | dZ | Unless the BRIDGE Shape_Options is specified (see below), the Z Shape lines adjust the Zpts as described in Table 7.6 for the same attribute. | Float |
| 3 | Shape_Width_or_dMax |
Refer to the same attribute in Table 7.6. Note that thin evacuation routes could produce misleading results if the cell face elevation is variable and the lowest elevation doesn’t fall exactly on the centre of the cell face. |
Float |
| 4 | Shape_Options | BRIDGE: Does not use the Z attribute to adjust the Zpts, instead uses it to assign evacuation route categories. This allows for a Z Shape Route Line to cross a river without physically blocking it. Because a route can be comprised of more than one line (as long as each line is given the same Route_Name) they will all be regarded as being part of the same route. To represent a bridge, split the route line either side of the bridge and give all three lines the same Route_Name, with the line representing the bridge or river crossing assigned a Shape_Options of “BRIDGE”. | Char(20) |
| 5 | Route_Name | Used to label the evacuation route. A route can be split into several lines if required, provided all the lines have the same Route_Name attribute. This can be useful where the route is more easily sourced or digitised as several lines, or if using the BRIDGE option described above. | Char(40) |
| 6 | Cut_Off_Type |
Options are as follows:
\[Energy Depth = d + \frac{V^2}{2g}\] More than one 2d_zshr layer may be used if different cut-off types are required. |
Char(40) |
| 7 | Cut_Off_Values | A comma delimited list of one or more values (e.g. depths) used to categorise the severity of the overtopping along the routes. For example, if “0.1, 0.3, 0.7” is specified for a depth Cut_Off_Type, then where the water depth exceeds 0.1 m, these sections of the route are assigned a Category 1; above 0.3 m deep Category 2; and above 0.7 m Category 3. The values must be in ascending order. Elsewhere the route is assigned Category 0 (i.e. no or less than Category 1 overtopping). The Route Categories are output over time in the _RC.dat file and summarised in the _RCP layer. Multiple cut-off values allow for the assessment of different risk levels (e.g. shallow depths would be acceptable for most vehicles and people to safely negotiate, while deeper depths would only be acceptable for higher set vehicles). | Char(80) |
| GIS Attribute | Description |
|---|---|
| Route_Name | The name of the route. |
| Cut_Off_Value | The cut off value applied. |
| First_Cut_Off_Time | The simulation time in hours the Cut_Off_Value was first exceeded. |
| Last_Cut_Off_Time | The simulation time in hours when the Cut_Off_Value was last exceeded. |
| Duration_Cut_Off | The duration in hours that the Cut_Off_Value was exceeded – not necessarily the difference between the first and last cut off times if the route reopened during this time. |