15.1 Folder Structure
Simulation outputs are written, by default, as long as the Map Output Interval tcf command has been specified (a mandatory command). If an output folder has not been specified (see Section 11.1), TUFLOW will write results to the folder in which the .tcf is located. It is recommended to use the Output Folder command to write results to a results folder, for example ‘TUFLOW\results’.
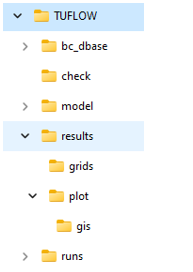
The adjacent image shows the typical folder structure of a TUFLOW model folder, including the breakdown of the results folder. The typical files found within the results folder are listed in Table 15.1. Note, this will depend on the model and the output commands specified in the .tcf.
If no other output commands (detailed in Chapter 11) have been defined, by default TUFLOW will write outputs in XMDF format, at the interval specified by the mandatory Map Output Interval command.
Within the results folder, TUFLOW will automatically create a ‘plot’ folder (for example ‘TUFLOW\results\plot’), containing both the .tpc output and a gis folder containing the TUFLOW plot output in .csv and GIS format (see Section 11.3). If the user has requested grid outputs, TUFLOW will automatically create a ‘grids’ folder in the location where the results have been written (for example ‘TUFLOW\results\grids’).
What TUFLOW outputs depends on the output settings specified in the model. Table 15.1 describes the typical files contained within the Output folder. If using the Output Folder command within the .ecf (or Start 1D Domain block) some of these outputs will be located in the folder referenced by that command.
| Folder | Filename | Description |
|---|---|---|
| results\ | .xmdf / .dat | The 2D temporal mesh output (e.g. XMDF or DAT and associated file types). See Section 15.3.1 for information on how to view these outputs. |
| results\ |
_MB.csv _MB_HPC.csv _MB1d.csv _1d_MB.csv |
Contains information on inflows and outflows, volume, predicted volume error and the mass and cumulative mass errors as a percentage. See Section 14.7.3 and Section 14.7.4 for information on these outputs. |
| results\ |
_PO.csv _POMM.csv |
Contains time series data output from 2D domains, for a range of hydraulic parameters based on the specified time-series output data type. |
| results\ |
_TS _TSF _TSL _TSMB _TSMB1d2d |
The _TS GIS layers contain time-series output with each layer presenting different information. |
| results\ | _1d_ccA | Contains information on culverts and bridges. See Section 15.2.3 for more information. |
| results\ |
_1D_mmH _1D_mmQ _1D_mmV |
GIS layers containing maximum/minimum values for water levels at nodes, and flows and velocities in channels. See Section 15.2.2 for more information. |
| results\grid | .tif / .flt / .asc | TUFLOW automatically writes raster outputs to a results\grids folder, in the format specified by the Map Output Format command. Users typically write maximum raster output only. User the mesh output for the temporal outputs due to file size and viewing abilities. See Section 15.3.2 for information on how to view these outputs. |
| results\plot\ | .tpc | TUFLOW Plot Control file is a text file. It is used by the QGIS TUFLOW Plugin to load plotting dataset, as documented in the TUFLOW Wiki. |
| results\plot\csv\ |
_1d_Chan.csv _1d_Cmx.csv _1d_Nmx.csv _1d_Node.csv |
The _1d_Chan layer contains information on the channel connectivity and properties. The _1d_Cmx layer contains the channel maximums data: flows and velocities as well as time of the maximums. The _1d_Nmx layer contains the node maximums data: water levels and energy levels. The _1d_Node layer contains information on the 1D nodes. |
| results\plot\csv\ | _1d_<ot>.csv | Time series output for output type <ot> at the 1D nodes or channels. The output is controlled by the Output Data Types command, which by default includes “H”, “Q”, “S” and “V”. |
| results\plot\csv\ | _1d_O.csv | Operational structures time series output, including information on the operational status and time varying values of variables. |
| results\plot\csv\ | _2d_<ot>.csv | Time series output for each 2d_po output type <ot>, as triggered by Read GIS PO commands. |
| results\plot\csv\ |
_RLP_H.csv _RLP_Hmx.csv _RLL_Q.csv _RLL_Qmx.csv _RLR_Vol.csv _RLR_Volmx.csv |
Reporting Location water levels (_H) and maximums plus other information at the peak water level (_Hmx). |
| results\plot\csv\ |
_SHmx.csv _SQ.csv |
Maximums and other information (_SHmx) and time-series total structure flow (_SQ) for all 1D structures and grouped structure output (see Section 11.3.4). This output is controlled by the “S” option in Output Data Types, which by default includes “S”. |
| results\plot\gis\ | _PLOT.csv | Summary .csv file containing information on the GIS objects and plot types available. |
| results\plot\gis\ |
_PLOT_L _PLOT_P _PLOT_R |
GIS layer in a vector format containing all plot line objects (e.g. 1D channels and flow Reporting Locations), plot point objects (e.g. 1D nodes and water level Reporting Locations) or region objects (e.g. total volume within the region). |