16.1 Model Health
Due to the computational differences associated with the two solvers, TUFLOW Classic and TUFLOW HPC, there are slightly different approaches to assess and deal with model health issues in each. The following sections will outline the characteristics of unhealthy models in TUFLOW Classic and HPC separately, though the general approach to troubleshooting is very similar.
16.1.1 TUFLOW Classic
Unhealthy TUFLOW Classic models usually exhibit one or more of the following characteristics:
- The model only remains stable if using a smaller than recommended timestep.
- Poor mass error (> ±1 %) as indicated by the “CE” percentages displayed to the Console Window (see Section 14.1.1), and output to the various mass balance files as described in Section 14.7.
- “Unnatural” fluctuations of flow in/out and change in volume values (i.e. the Qi, Qo and dV values displayed to the Console Window) discussed in Section 14.1.1.
- Locations in the model that repetitively have negative depth WARNINGs. These repeatedly appear as a message such as: “WARNING 2991 - Negative U depth at [030;088], Time = 0:01:30, Depth = -0.4…”. The occurrence of the message several times at a location is usually not an issue (this means that the model experienced a short and slight numerical disturbance), however, if it repeatedly occurs for a period of time, it is good practice to resolve the source of the problem as this numerical disturbance may cause mass errors, possibly forcing the use of too small a timestep, and may initiate an instability in a future simulation.
If one or more of the above apply, the model needs to be reviewed and the cause of the unhealthy behaviour identified. This can be a daunting and difficult task for inexperienced modellers, however, the guidelines in the sections below are hopefully of some assistance.
16.1.1.1 Timestep
For the majority of TUFLOW Classic flood models, the 2D Timestep in seconds should be somewhere between \(\frac{1}{2}\) to \(\frac{1}{5}\) of the 2D Cell Size (in metres). For example, a 10m 2D grid should use a timestep of between 2 and 5 seconds. 2D domains with predominantly sub-critical flow usually can have timesteps larger than those for steeper models with significant areas of supercritical flow.
For coastal models, models with large cell sizes (>50m) or models with significant areas of deep water (>20m), the above rule-of-thumb may not apply with the timestep often being smaller. This is due to the Courant condition described in Section 3.4.
There is a tendency for hydraulic modellers to “solve” an instability by reducing the model timestep. Whilst this may “work”, if the required timestep is less than the above mentioned recommended minimums, it is usually not solving the fundamental cause of the model’s poor hydraulic performance or instability. Using too small a timestep can mask fundamental problems in the input data, and hide mistakes in the construction of the model. For example, if the user accidentally applies a topography modifier with an elevation -99m below the surrounding cells, a small timestep may “remove” the instability but does not resolve the issues in the input data.
Using a too large a timestep will cause mass errors. If the model runs stable without any negative depth warnings, yet the cumulative mass error is poor throughout the simulation, this is often an indication that the 1D and/or 2D timesteps are too large.
16.1.2 TUFLOW HPC
TUFLOW HPC uses an explicit finite volume scheme. It uses an automatic adaptive timestep routine which is unconditionally stable and provides 100% 2D mass conservation. TUFLOW HPC will not show a mass balance error like TUFLOW Classic but rather, in situations where the stability is threatened, the model timestep is reduced. In recognition of this behaviour, reviewing the minimum timestep is useful in determining the health of a TUFLOW HPC model. For TUFLOW HPC, the *_dt_Min map output file can be used to identify the specific location that is requiring the minimum timestep to achieve simulation stability. This is useful output to help identify where the modeller should be reviewing model inputs and model schematisation.
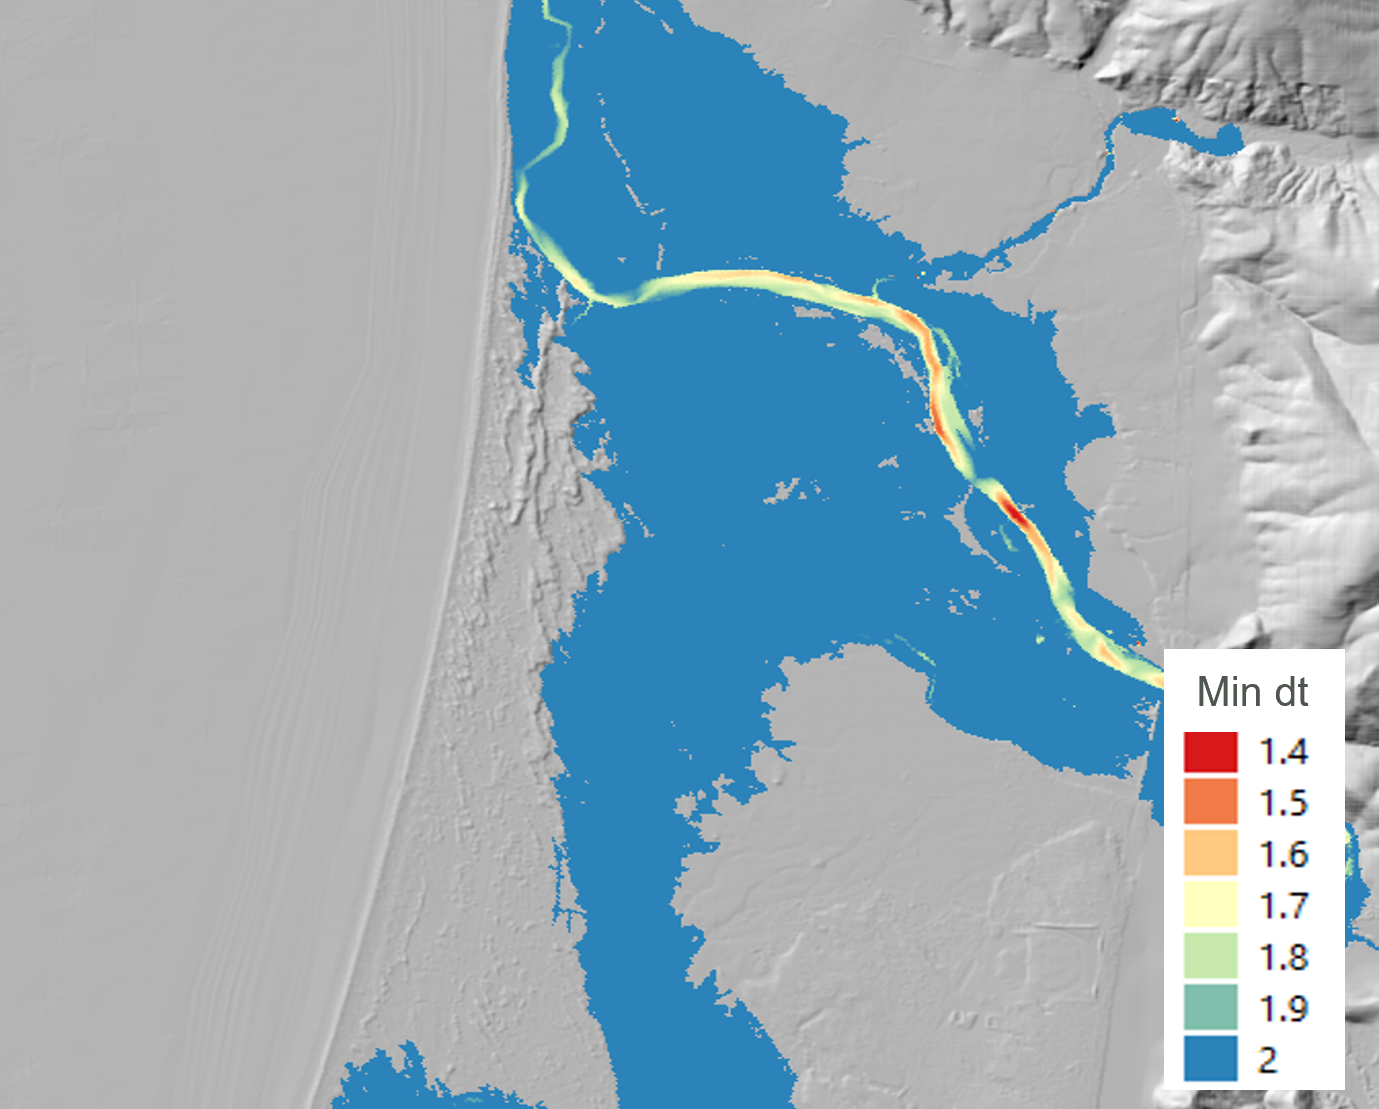
Figure 16.1: TUFLOW HPC Minimum Timestep (dt) Map Output
Unhealthy TUFLOW HPC models usually exhibit one or more of the following characteristics:
- A large number of repeat timesteps within the Console Window. The total number of repeated timesteps is recorded in the Simulation Summary section at the end of the .tlf file, and is reported to the _messages layer. Repeated timesteps are an indication that the TUFLOW HPC 2D solution is numerically “on-the-edge”. Models that have a high number of repeated timesteps should be sensitivity tested by reducing the control number limits using the Control Number Factor command.
- The model only remains stable if using an excessively small timestep.
- Oscillating timesteps and controls numbers as shown in the *.hpc.dt.csv output to the log folder.
- “Unnatural” fluctuations of flow in/out and change in volume values (i.e. the Qi, Qo and dV values displayed to the Console Window) discussed in Section 14.1.1.
Like TUFLOW Classic, if one or more of the above apply, the model needs to be reviewed, the cause identified and rectified.
Note: Although TUFLOW HPC is 100% mass conservative and will not produce any mass error in the 2D, it is still important to review the Mass Error from a simulation. Mass Error can occur in poorly configured models when coupling HPC with 1D elements (either associated with the 1D/2D linking or in the 1D scheme itself).
16.1.2.1 Timestep
The TUFLOW HPC solver, by default, uses adaptive timestepping to progress through the simulation. The timestep is adjusted so that it complies with the mathematical stability criteria of a 2D explicit solution. Due to the underlying solution scheme, TUFLOW HPC typically uses a smaller timestep than Classic. As a general rule, a healthy TUFLOW HPC timestep is roughly \(\frac{1}{10}\) of a TUFLOW Classic healthy timestep (i.e. for a cell size of 10m, a healthy TUFLOW Classic timestep would be 2 to 5s, and a healthy TUFLOW HPC timestep would be between 0.2 to 0.5s).
There are three primary processes that determine the maximum timestep that an explicit solution of the Shallow Water Equations can use:
- Courant Number, Nu: The Courant number relates to velocity relative to the cell size. Higher velocities will trigger this as the timestep control.
- Wave Celerity Number, Nc: The Celerity Control number relates to water depth relative to cell size. Energy can pass through deeper water faster than shallow water, as such deep water will trigger this control.
- Diffusion Number, Nd: The diffusion control relates diffusion of momentum relating to the sub grid viscosity. Small cells subject to deep water will trigger this control.
Further description of these control numbers is provided on the TUFLOW Wiki HPC Adaptive Timestepping page.
TUFLOW will use the highest timestep possible without exceeding the limits associated with each of the control numbers. The .hpc.tlf log file records the model timestep, control numbers and the volume of water in model at each timestep. It also shows repeated timesteps if the control number limits were exceeded or there is a significant change in control numbers (more than 20%). If a model has a sudden change in rainfall between timesteps, or has a warmup period with small flow rate before a large inflow then repeated timesteps are possible. However, if there is a high occurrence of repeating timesteps when the boundary inflows are smooth, this could be an indicator of model instability. The total number of repeated timesteps is also recorded in Simulation Summary of the .tlf file.
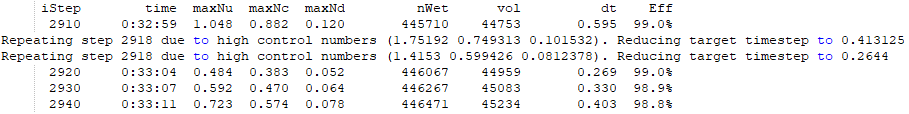
Figure 16.2: TUFLOW HPC.TLF Repeating Timesteps
It is possible to plot the time-varying control number settings from the *.hpc.dt.csv that is output to the log folder when running a TUFLOW HPC simulation. This can be done using spreadsheet software such as Excel, or a scripting language such as python. An example using a drag and drop tool, the TUFLOW Summary Dashboard, is shown in Figure 16.3. The tool is available on the TUFLOW Gitlab User Group.
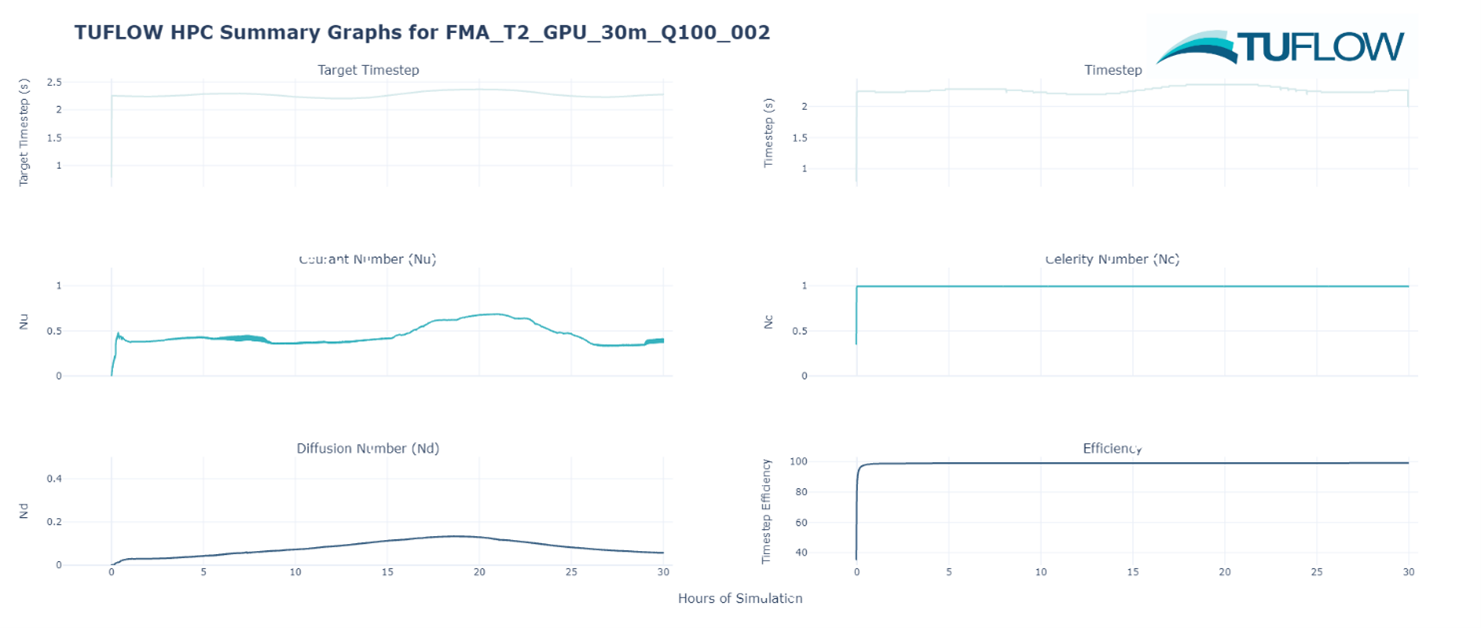
Figure 16.3: Timestep and Control Numbers plotted from the .hpc.dt.csv
The two key features that modellers should look for in the hpc.dt.csv output, is erratic oscillation of the timestep values and extremely low timesteps. If an oscillating timestep or an unusually low timestep is observed in the HPC dt time series, it is important to review the associated value for each control number (Nu, Nc and Nd). This will allow the modeller to determine which hydraulic condition is limiting the timestep. Since the 2023-03 release of TUFLOW, it is also possible to provide map output for the three control number using the Map Output Data Types command which can also help identify model features leading to reduced timesteps.
16.1.3 Healthy Model Indicators
A summary of healthy model indicators is provided at the end of the simulation on the display console, and at the end of the .tlf file. A selection of these indicators are also written to the “_ TUFLOW Simulations.log” files – see Section 14.3. The indicators are discussed in Table 16.1 below.
Note, these model health reporting items should be used in conjunction with good model review practices. They are a set of indicators of various model health parameters. They are not definitive proof that a simulation was or was not healthy.
| Model Health Reporting Item | Description | Solver |
|---|---|---|
| Total Negative Depths |
The occurrence of negative depths at 1D nodes or 2D cell sides is an indication that the solution has not converged or has over-stepped at that location and time. WARNING 1991 for 1D nodes and WARNING 2991 at 2D cell mid-sides are issued each time a negative depth greater than -0.1m occurs. The location of these warnings can be viewed using the _messages GIS layer. From a healthy model perspective, the occasional negative depth is not necessarily a concern, but repeat occurrences at the same location are an indication of a potential issue. See Section 16.2.2 for further discussion. Negative depths may often precede an instability. |
Classic/HPC |
| WARNINGs and CHECKs prior to and during simulation | Number of CHECKs and WARNINGs issued. At key stages of a project, review any CHECKs and WARNINGs, and if needed, resolve any issues, particularly for WARNINGs. If a CHECK or WARNING is not in the _messages layer, this means that it could not be located geographically and only occurs in the .tlf file (search the .tlf file to review them). | Classic/HPC |
| Peak Flow In and Out (m3/s) | Review these numbers in the sense that they are in accordance with your expectations. Usually the “Peak Flow In” exceeds the “Peak Flow Out” for flood simulations due to the flood wave being attenuated as it travels through the model. Note, at boundaries where a circulation develops, there will be flow in and out and these amounts will contribute to the Flow In and Out of the model as reported here and in the _MB.csv files. This behaviour is indicative of a boundary line that is not well aligned (perpendicular to flow) and possibly should be changed. | Classic |
| Volume at Start and End (m3) | The volume of water in the model at the start and end of the simulation. Review these numbers, and confirm they are sensible. A very large residual volume at the end of the simulation may indicate that the simulation was not run for long enough, for example, the flood may not have reached its peak. The time of peak water level is also a good indicator of this, if the time of peak water level is the same as the end time of the simulation, the simulation has likely not run long enough for the flood waters to peak. | Classic/HPC |
| Volume In and Out (m3) | The total volume of water in and out of the model during the simulation. Review these numbers to confirm they make sense. Usually the volume out is less than the volume in, as the model has a residual amount of water left in it at the end of the simulation. | Classic/HPC |
| Volume Error (m3) Final Cumulative ME% |
Volume Error is the loss or gain in water over the course of the simulation. Volume Error is equal to: (Total Volume In - Total Volume Out) – (Volume at End – Volume at Start) The Volume Error % value is the Volume Error divided by the Volume In + Out.The Final Cumulative Mass Error % is calculated throughout the simulation using a similar formula, so should be similar to the Volume Error %. Ideally these values should be less than 1%, but 2 or 3% can be acceptable depending on the objectives of the modelling. Values exceeding 3% usually indicate there are significant problems with the model. |
Classic/HPC |
| Peak +ve and –ve dV (m3) |
dV is the change in volume over the whole model in one timestep, and the values shown here are the peak positive and negative dV values. Note: these values will be different to those shown on the display console or in the _MB.csv files if the Screen/Log Display Interval or Mass Balance Output Interval are not set to the computational timestep. The time in hours that the Peak dV values occurred is also shown. |
Classic |
| Peak ddV (m3) (% of Peak dV) | Peak ddV is the maximum (positive or negative) change in dV over one timestep, and the % value is the % of the maximum Peak dV value. A large ddV value or % indicates the model may have been unsteady at some point. This may not be unusual in a model with complex hydraulics, however, it is another indicator of whether there may be somewhere in the model that needs reviewing. | Classic |
| Peak Cumulative ME | The peak CME% value that occurred. As discussed above, ideally this value should be less than 1%, though larger values can be acceptable depending on the objectives of the modelling. For example, higher numbers may occur during the intimal wetting of a Classic model, though still have a negligible impact on the overall model results. | Classic |
| Values under “Qi+Qo > 5%” | The values under “Qi+Qo > 5%” are for the period of the simulation when the flow in and out exceeded 5% of the peak flow in and out, and are representative of the bulk of the simulation once the flood wave has begun flowing. These indicators are designed to exclude an initial period of any unsteadiness at the start of the simulation that may occur in some models. | Classic |
| HPC HCN Repeated Timesteps |
TUFLOW HPC repeats timesteps if the control number limits are exceeded or if there is a significant change in control numbers (>20%). The three control numbers (Courant Number, Wave Celerity Number and Diffusion Number) determine the maximum timestep for the TUFLOW HPC adaptive timestepping. They are reported in the tlf and in the hpc.dt.csv. In general terms:
|
HPC |
| HPC NaN Repeated Timesteps | Each TUFLOW HPC timestep is tested for the occurrence of a NaN (Not a Number) which can occurs due to undefined mathematical calculations such as a divide by zero or square root of a negative number. The occurrence of a NaN is indicative of a sudden instability. | HPC |
| HPC NaN Warning 2550 | Provides the cumulative sum of the number of TUFLOW HPC timestep corrections (indicated by WARNING 2550) have been made in order for the TUFLOW HPC solution to remain stable. Whilst not always sign of an unstable model, it is worth reviewing especially in the case of a large number of repeated timesteps. | HPC |