14.1 Console Window Display
TUFLOW displays a lot of information to the Console Window during the data input and simulations stages. However, this typically processes so quick, that it may be difficult to read. The log file (.tlf) (Section 14.4) and check files (Section 14.6) contains this information in much more usable formats, most of which is geo-referenced GIS layers. However, should you wish, you can look back through the Window buffer to establish where in the input data process the problem occurs.
After a model has completed initialising its input data and has started its computations, the simulation status is displayed. The default display frequency for TUFLOW Classic is every timestep and for TUFLOW HPC on GPU is every 100 timesteps. To change the frequency of display, the Screen/Log Display Interval command can be used. Where different timesteps are used for different domains, the display interval is based on the largest timestep. The console window contains a lot of useful information to keep an eye on your simulations as they progress. Whilst it isn’t expected to continuously watch the simulations console window, it is useful to glance at occasionally to check that your simulations are “happy”.
If the Console window does not appear (i.e. TUFLOW.exe won’t start) there could be a few reasons why, this is discussed on the TUFLOW Wiki TUFLOW Crashing page.
If you are running from a batch file and the window briefly appears, then disappears straight away, you can force the window to stay open so you can diagnose the issue. This is discussed in Section 14.1.3.
14.1.1 TUFLOW Classic
Once the hydraulic calculations commence, the TUFLOW Classic Console Window appears as something similar to that shown below:
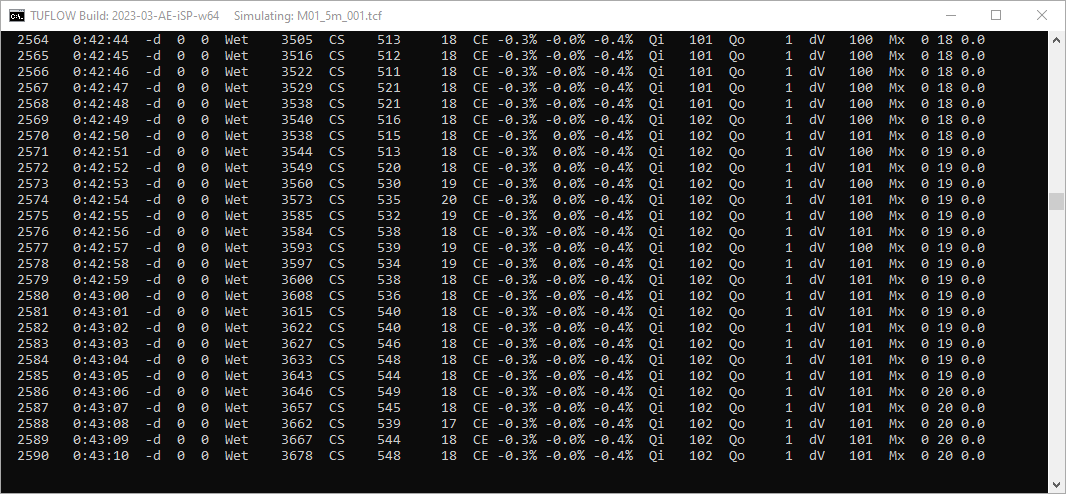
Figure 14.1: Example TUFLOW Classic Console Display Window
The following information is shown along each line in order of occurrence.
- Number of timesteps completed, based on the largest timestep of all 1D and 2D domains.
- Simulation time in hhhh:mm:ss.
- “-d” followed by two numbers:
- The maximum number of 1D nodes per timestep that experienced negative depths below ‑0.1m since the previous display line.
- The maximum number of 2D cell sides per timestep that experienced negative depths below ‑0.1m since the previous display line.
The locations of these negative depths are output as warnings in the _messages layer (see Section 14.4.5). Negative depths indicate the model is having difficulty in convergence at that location, which may lead to an instability. See also Section 16.2.2.
- The maximum number of 1D nodes per timestep that experienced negative depths below ‑0.1m since the previous display line.
- “Wet” followed by number of wet or active 2D cells.
- If automatic weir switching is active (see Free Overfall) the next information is “CS” (CellSides) followed by two numbers as follows:
- The number of cell sides where upstream controlled friction flow occurred (see Supercritical).
- The number of cell sides where upstream controlled broad-crested weir flow occurred (see Free Overfall).
- The number of cell sides where upstream controlled friction flow occurred (see Supercritical).
- If the free-overfall algorithm is set to ON WITHOUT WEIRS (see Free Overfall), the next information is “FO” followed by the number of cell sides where the free-overfall algorithm is being applied. Note: this option is now rarely used in lieu of the automatic weir and supercritical flow options.
- If Display Water Level was specified, the next piece of information is a “GL” (Gauge Level) followed by the water level at the location indicated. This is useful to monitor the rise and fall of the water level at a key location.
- If Mass Balance Output is set to ON, “CE” (Cumulative Error) followed by three percentages is displayed to show the cumulative mass error as follows:
- The whole of model % cumulative mass error for all 1D and 2D domains.
- The % cumulative mass error for all 1D domains.
- The % cumulative mass error for all 2D domains.
- The whole of model % cumulative mass error for all 1D and 2D domains.
- If Mass Balance Output is set to ON the following are displayed after the “CE” percentages:
- “Qi” followed by the total flow into the model (all domains) in m3/s (or ft3/s if using
Units == US Customary ). If the inflow exceeds 999999m3/s or falls below -99999m3/s, the flow is expressed in units of 1,000m3/s and a single quote symbol is displayed after the number. A double quote symbol indicates the flow is expressed in units of 1,000,000m3/s.
- “Qo” followed by the total flow out of the model (all domains) in m3/s (or ft3/s if using
Units == US Customary ). If the outflow exceeds 999999m3/s or falls below -99999m3/s, the flow is expressed in units of 1,000m3/s and a single quote symbol is displayed after the number. A double quote symbol indicates the flow is expressed in units of 1,000,000m3/s.
- “dV” followed by the change in volume in m3 (or ft3 if using
Units == US Customary ) of the model (all domains) since the last display time. If the change in volume exceeds 999999m3 or falls below -99999m3, the amount is expressed in units of 1,000m3 (mL) and a single quote symbol is displayed after the number. A double quote symbol indicates the change in volume is expressed in units of 1,000,000m3.
- “Qi” followed by the total flow into the model (all domains) in m3/s (or ft3/s if using
- If maximums are being tracked (i.e. Maximums and Minimums is set to ON or ON MAXIMUMS ONLY), additional information will be displayed to the Console Window and .tlf file for each Screen/Log Display Interval. Three numbers are displayed after “Mx” at the end of each line. The first two numbers are the percentage of 1D nodes and percentage of 2D cells that reached a new maximum in the last computational timestep. The third number is the time in decimal hours since no new maximum was recorded anywhere within the model. For example, “Mx 10 21 0.0” indicates that 10% of 1D nodes and 21% of 2D cells recorded a new maximum last timestep, and the time since the last recorded maximum is zero. Once all 1D nodes and 2D cells have reached their maximums the third (time) value will increase above zero.
The negative depth numbers, cumulative error percentages, inflow, outflow and change in volume figures are very useful to gauge the health of the model. Frequent negative depths, poor cumulative error (>1%, noting that some models will show a high mass error at the start, which can be acceptable provided it diminishes quickly) and “bouncy” inflow, outflow and change in volume values are all indicators of an unhealthy model. For further discussion see Section 16.1.
Whenever the map output is written (see Start Map Output and Map Output Interval), a line “Writing Output at:” is displayed, followed by the simulation clock time and CPU time. If the CPU time is significantly lower than the clock time, then either the simulation was paused for a period of time (see Section 14.1.4), the CPU is overloaded or the CPU is not being fully utilised (having Hyper Threading switched on can cause this to occur).
14.1.2 TUFLOW HPC
Once the hydraulic calculations commence, the TUFLOW HPC Console Window appears similar to the two images shown below:
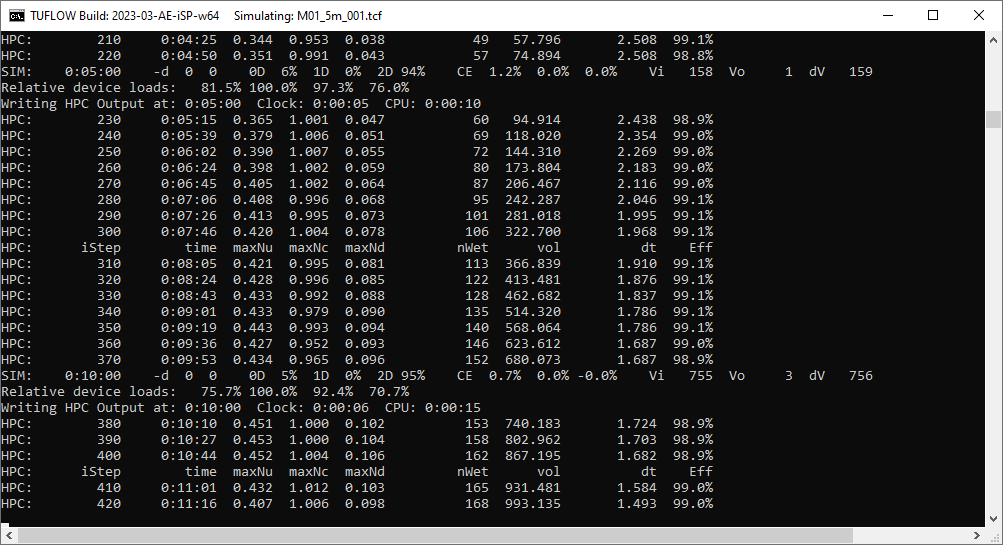
Figure 14.2: Example TUFLOW HPC Console Display Windows
For lines starting with “HPC:” the following information is shown along each line in order of occurrence.
- Number of timesteps completed, based on the largest timestep of all 1D and 2D domains.
- Simulation time in hhhh:mm:ss.
- Timestep Control Numbers:
- Nu: Courant Number.
- Nc: Shallow Wave Celerity Number.
- Nd: Diffusion Number.
- Nu: Courant Number.
- Number of wet cells.
- Volume.
- Computed timestep.
- The timestep efficiency.
If the model contains virtual pipe networks, the following additional information is shown:
- qInlet: flow extracted from the 2D domain.
- qSurcharge: flow surcharging out of inlets, due to the outlet flow being limited.
- qOutput: flow entering the 2D domain.
For lines starting with “SIM:”, which occur at regular simulation time increments, additional statistics are output:
- Simulation time in hhhh:mm:ss.
- “-d” followed by two numbers:
- The maximum number of 1D nodes per timestep that experienced negative depths below ‑0.1m since the previous display line.
- The maximum number of 2D cell sides per timestep that experienced negative depths below ‑0.1m since the previous display line.
- The maximum number of 1D nodes per timestep that experienced negative depths below ‑0.1m since the previous display line.
- Three compute percentage values:
- 0D % time spent on pre/post processing and CPU/GPU communication overhead.
- 1D % time spent on 1D compute.
- 2D % time spent on 2D compute.
- 0D % time spent on pre/post processing and CPU/GPU communication overhead.
- “CE” (Cumulative Error) followed by three percentages is displayed to show the cumulative mass error as follows:
- The whole of model % cumulative mass error for all 1D and 2D domains.
- The % cumulative mass error for all 1D domains.
- The % cumulative mass error for all 2D domains.
- The whole of model % cumulative mass error for all 1D and 2D domains.
- Model volumes:
- “Vi” followed by the total volume of water into the model in m3/s (or ft3/s if using
Units == US Customary ). If the volume in exceeds 999999m3 or falls below -99999m3, the amount is expressed in units of 1,000m3 (mL) and a single quote symbol is displayed after the number. A double quote symbol indicates the change in volume is expressed in units of 1,000,000m3. - “Vo” followed by the total volume of water out of the model (all domains) in m3/s (or ft3/s if using
Units == US Customary ). If the volume out exceeds 999999m3 or falls below -99999m3, the amount is expressed in units of 1,000m3 (mL) and a single quote symbol is displayed after the number. A double quote symbol indicates the change in volume is expressed in units of 1,000,000m3.
- “dV” followed by the change in volume in m3 (or ft3 if using
Units == US Customary )of the model (all domains) since the last display time. If the change in volume exceeds 999999m3 or falls below -99999m3, the amount is expressed in units of 1,000m3 (mL) and a single quote symbol is displayed after the number. A double quote symbol indicates the change in volume is expressed in units of 1,000,000m3.
- “Vi” followed by the total volume of water into the model in m3/s (or ft3/s if using
14.1.3 The Console Window Does Not Appear
If you are running from a batch file and the window briefly appears, then disappears straight away, you can force the window to stay open so you can diagnose the issue.
To do this, insert “pause” at the end of the batch file and remove any Start “TUFLOW”, -b and/or -t switch. For example:
Pause
Using this simple batch file will start the simulation in the main batch window and give you greater control. Adding “Pause” at the end of the batch will keep the window open.
Common troubleshoot tips can be found here.
14.1.4 Unexpected Simulation Pause (Console Window Quick Edit Mode)
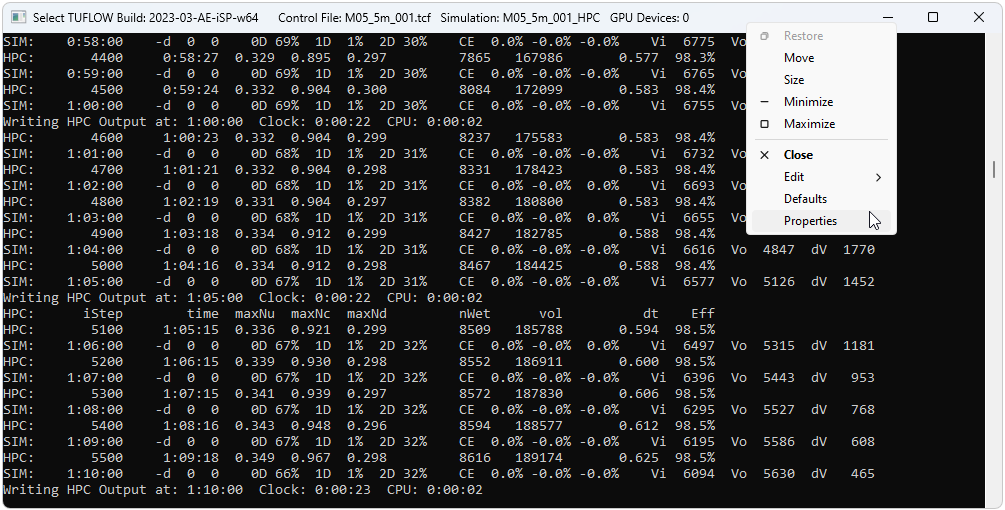
Windows 10 and onwards includes a Quick Edit mode option in the console window that can artificially pause TUFLOW simulations. The Quick edit mode is initiated if the cursor clicks somewhere on the console window while a TUFLOW simulation is running. Quick Edit mode can be deactivated to avoid this issue.
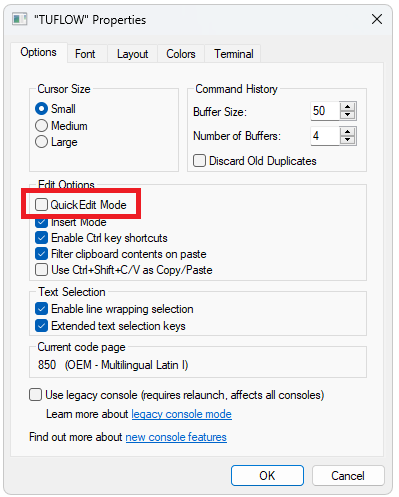
- Right click the console window header. Select “Properties”.
- Uncheck “Quick Edit Mode”. This will turn it off for the current session.
- Update the default console window properties so this becomes the default mode. Right click the console window header. Select “Defaults”.
- Uncheck “Quick Edit Mode”, just like in the “Properties” dialog box. This will turn Quick Edit Mode off for all future sessions.
14.1.5 Stopping the Console Window
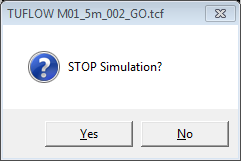
It is possible to stop a simulation by using Ctrl+C. When pressed the first time (with the TUFLOW console as the active window) the dialogue below is displayed asking whether to stop the simulation. Clicking on “Yes” will finish the simulation, write all output files and release any network dongle licence. The simulation is logged as being INTERRUPTED in the .tlf and .log files (refer to Section 14.3). Clicking on “No” will continue the simulation.
Ctrl+C is recommended instead of manually cancelling the simulation via clicking the display window close button. TUFLOW will not finalise writing the output result files if the simulation is cancelled via clicking the display window close button. For example, result maximums and minimums will not be written, even if Maximums and Minimums is set to ON.
In versions of Windows prior to Windows 10, it was possible to pause output processing in a terminal window by pressing Ctrl+S, which would effectively suspend TUFLOW. In modern versions of Windows, you may be able to achieve the same by either pressing Ctrl+S, the Pause button, or selecting text in the terminal window with the mouse (if quick edit mode is turned on, see Section 14.1.4). This depends on the versions of software used and their configuration.
14.1.6 Customisation of Console Window
The windows and buffer sizes of the Console Window are by default set by TUFLOW. During the model input stages the window is set to 122 characters wide and 30 lines high. During the hydraulic calculations the width varies depending on the length of the output to the window and the height is set to 40 lines.
It is possible to manually set the Console Window buffer as well as change the font and colours of the TUFLOW window. The latter may be useful when differentiating different models on a shared computer. For further information, refer to guidance found on the TUFLOW Wiki Console Window Tips Page.
14.1.7 TUFLOW Windows ERROR LEVEL Reporting
If TUFLOW exits unsuccessfully, e.g. an error during initialisation or due to the model going unstable an ERRORLEVEL is reported to the Windows operating system. This value is 1 if a premature exit has been encountered and 0 for a normal exit. This can be useful for tracking simulation issues if using batch files, scripts or a simulation run manager. In a batch file the error level can be obtained with the %errorlevel% variable. For example:
echo error level is %errorlevel%
Prior to the 2018-03-AA version of TUFLOW, no error level was reported.