1.3 Modelling Environment
TUFLOW offers a very powerful and workflow efficient approach to modelling. The approach combines simple and easy to produce control files or scripts together with the power of GIS software.
The fundamental software for building TUFLOW models and viewing results are a text editor, spreadsheet software and GIS software, as shown in Table 1.1. The free‑to‑use TUFLOW Viewer QGIS Plugin greatly enhances a modeller’s ability to quickly view time-series and map outputs, animate results and compare different simulations. The TUFLOW Viewer is documented on the TUFLOW Wiki TUFLOW Viewer.
TUFLOW’s implementation of this GIS based modelling environment approach offers major benefits, including:
- TUFLOW scripts (control files) allow modellers to readily and easily setup, modify and run numerous simulations, whether it be different calibration events, a batch of design events or various what-if scenarios investigating flood mitigation options.
- The modelling framework avoids the duplication of input datasets during the versioning of models. For example, the base DEM might be used by hundreds or thousands of simulations during a study, but it only needs to exist once; there is no need to copy the DEM for each simulation as is the case for GUI-based software.
- TUFLOW benefits from the unparalleled power of GIS as a “work environment”. GIS software are industry leaders at efficiently managing large, complex and numerous spatial datasets.
- GIS includes a suite of excellent data management, manipulation and presentation tools. The QGIS TUFLOW Viewer Plugin greatly enhances modellers’ ability to setup and view models and results.
- Working directly in GIS means model input data is geographically referenced, not 2D grid referenced, this supports workflow efficient model updates (such as changes to the model 2D cell size specification or boundary condition locations).
- Model results are written to non-proprietary open data formats compatible with most GIS software. This facilitates the efficient production of high-quality GIS based mapping for reports, brochures, plans and displays.
- TUFLOW is compatible with numerous different GIS packages (e.g. ArcGIS, QGIS and MapInfo). Modellers can chose to use the GIS software package of their choice.
- Seamless handover of model inputs and results to clients requiring data in GIS format. Clients are not required to purchase a TUFLOW licence to view results.
- Superior data and modelling quality control.
Section 2.1 outlines a variety of software packages available for constructing TUFLOW models and visualising simulation results. It lists a range of GIS software and also third party Graphical User Interface (GUI)’s options from TUFLOW’s partner organisations. This manual focuses on TUFLOW’s modelling within the GIS environment. For documentation relating to third-party TUFLOW GUIs, please refer to the third party’s product manual.
| Software | |
|---|---|
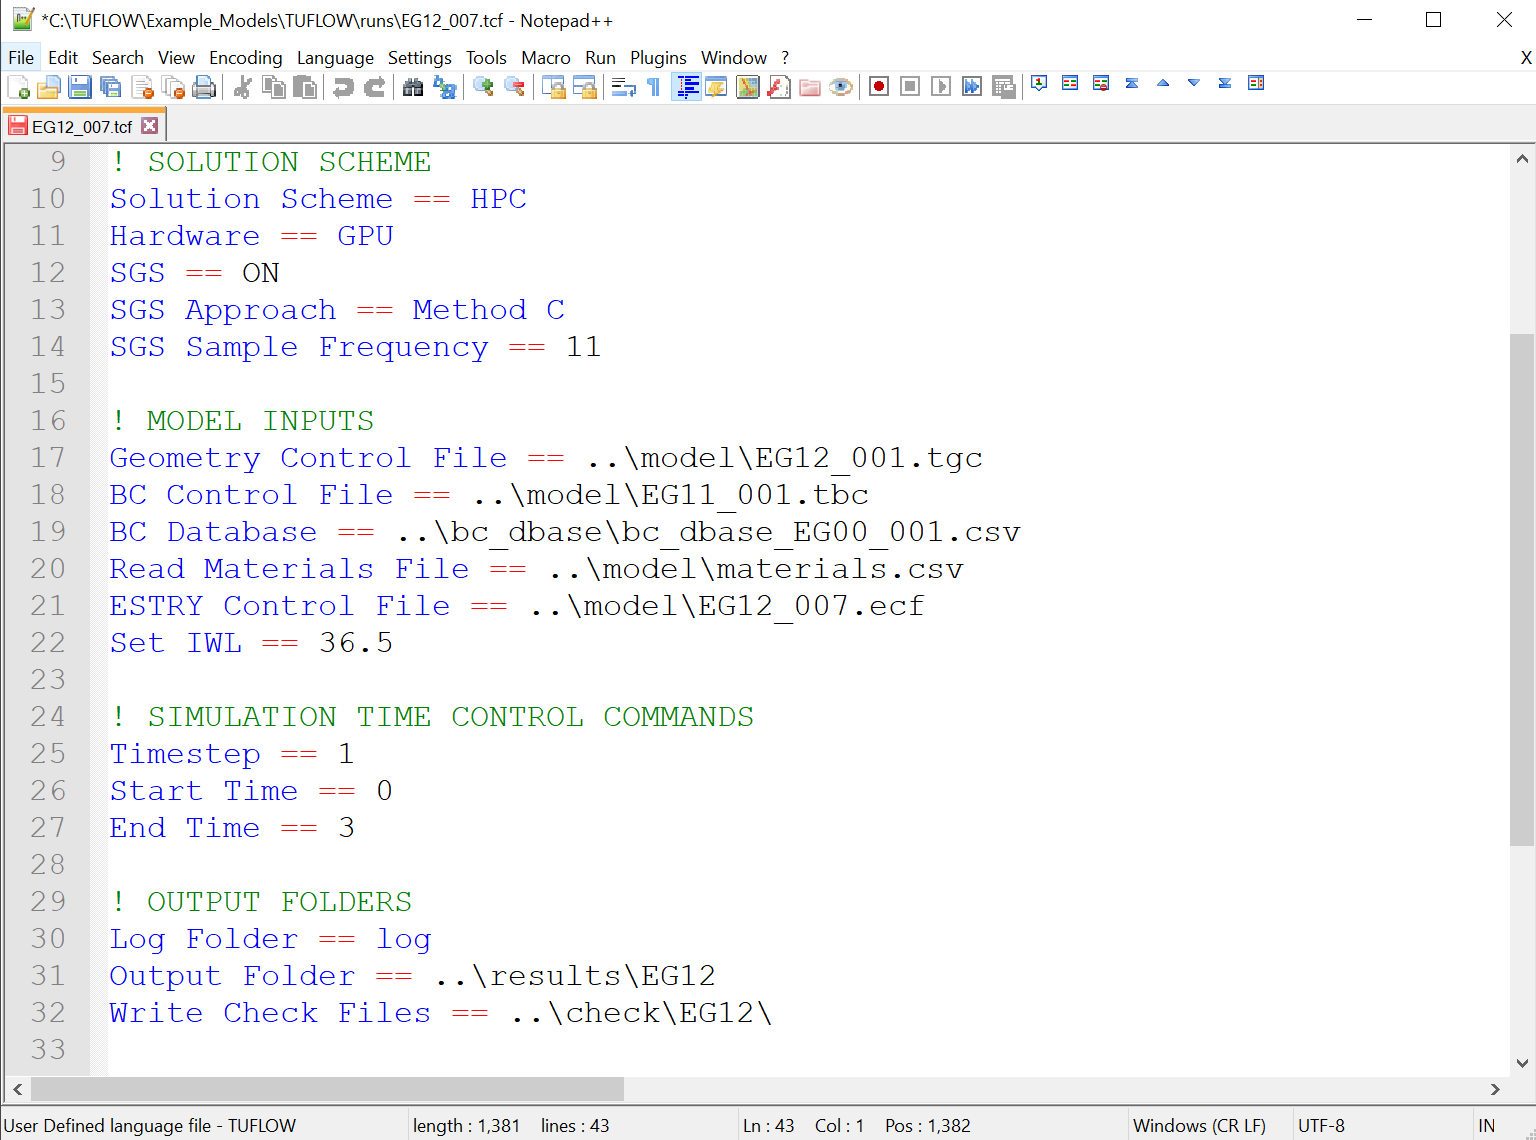
| A Text Editor is used to create and edit TUFLOW simulation control files. The control files list all the simulation commands and file path references to the above mentioned GIS and tabular datasets. |
|
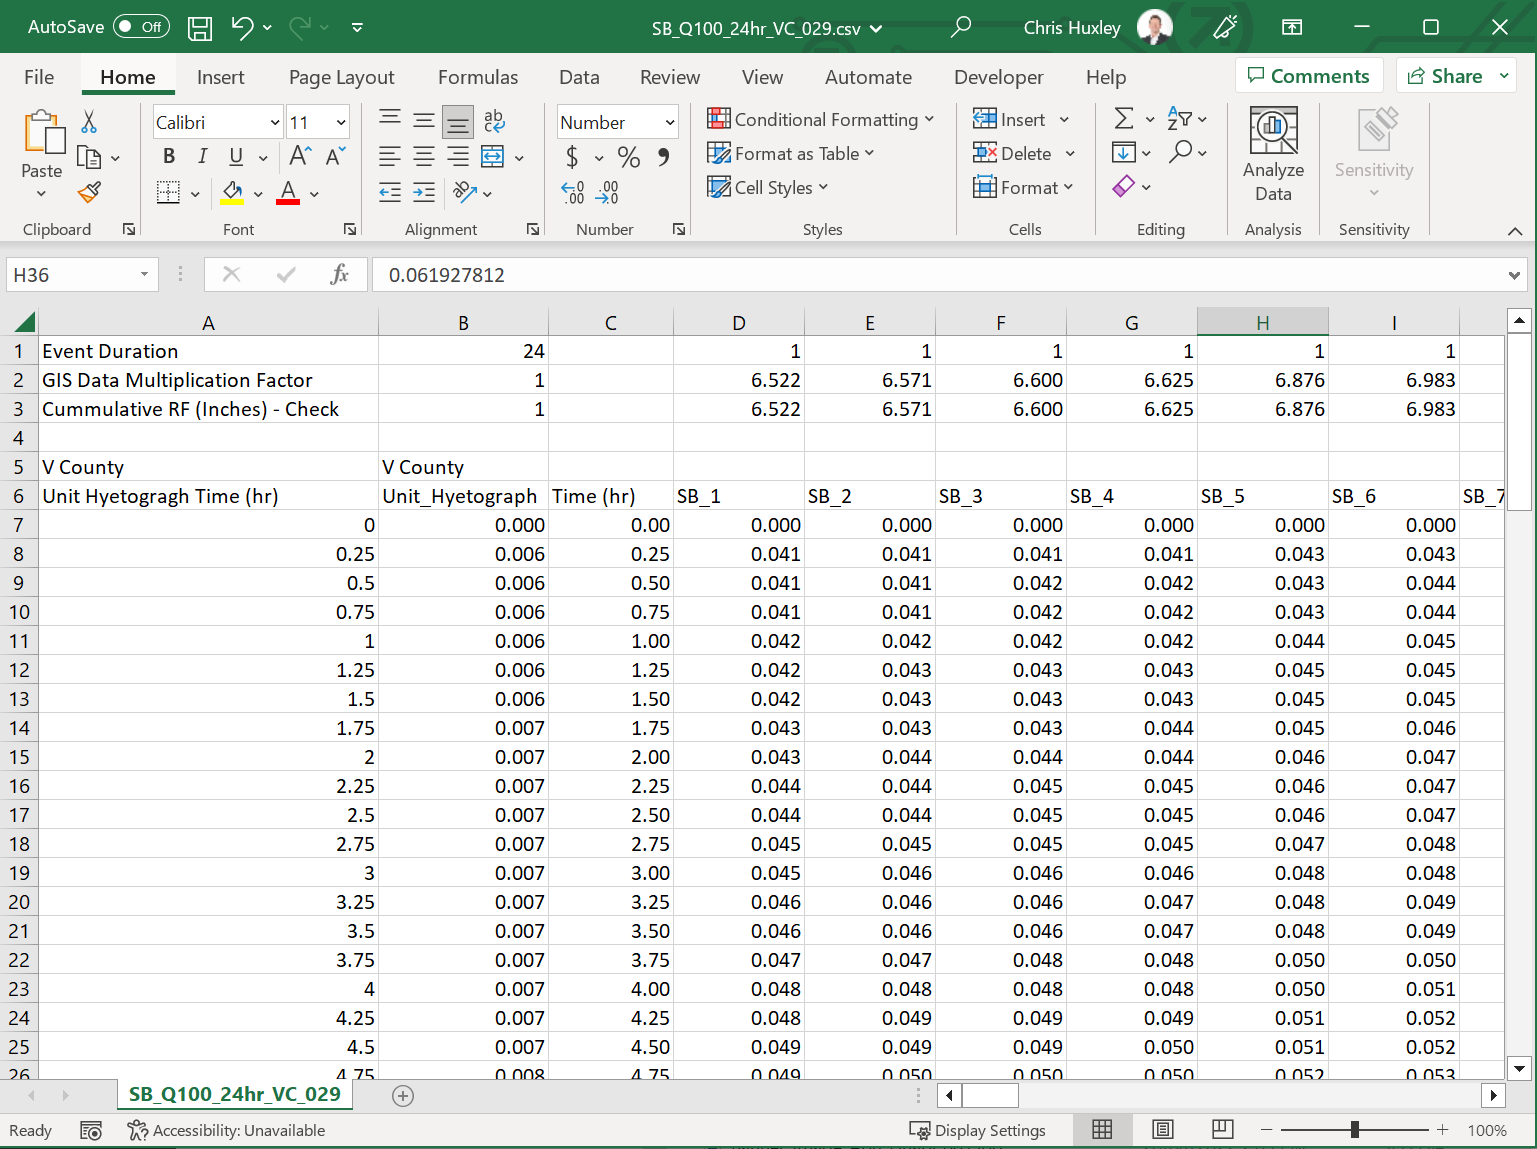
| Spreadsheet Software is used to tabulate time-series and other non-geographically located data. |
|
|
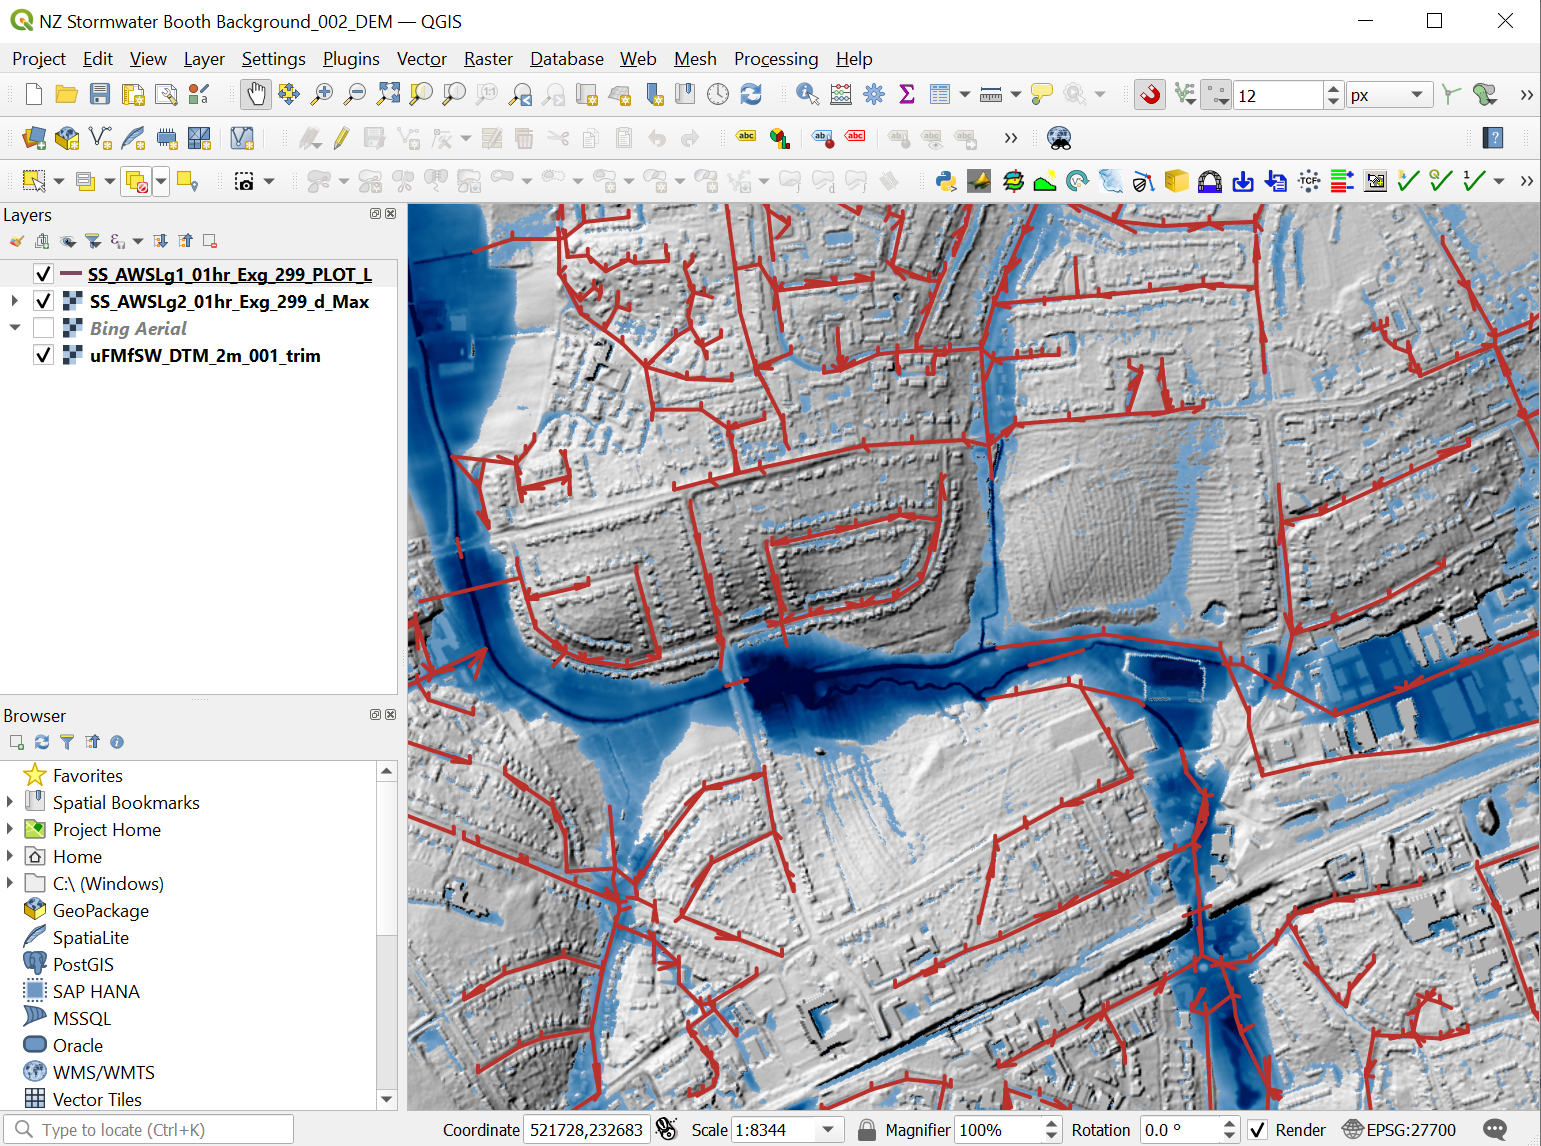
GIS Software is used to set up, modify, thematically map and manage all geographic inputs and to view simulation results. QGIS’s TUFLOW Viewer Plugin greatly enhances the modelling experience. |
|