14.4 Simulation Log Files
TUFLOW writes a number of files to a folder typically called the ‘log’ folder and contained within the ‘TUFLOW\runs’. The location can be controlled using the Log Folder command. The files written to this folder contain:
- TUFLOW Log File (.tlf)
- HPC TUFLOW Log File and HPC timestep history file (.hpc.tlf and .dt.csv)
- TUFLOW Summary File (.tsf)
- Simulation start statistics (start_stats.txt)
- Simulation run statistics (run_stats.txt)
- Messages (in both tabular and GIS format) (.csv and .gpkg/.shp/.mif)
- GIS workspace (.qgs and .wor)
14.4.1 TLF
TUFLOW produces a log file (.tlf file) containing a record of the simulation. TUFLOW HPC also produces a hpc.tlf file due to difficulties in coordinating CPU and GPU file writing processes - see Section 14.4.1.1. The file is very useful for establishing data input problems and identifying instabilities.
Take time to familiarise yourself with the content of the log file. Much of it is a repeat of the information displayed to the Console Window, so if you can’t access information from the Console Window, check the log file using a text editor.
At key stages during the model development and application search the file for any “WARNING”, “CHECK” or “NOTE” messages. “WARNING” messages in particular should be checked regularly. An “ERROR” keyword indicates an unrecoverable error and causes the simulation to stop. As many errors as possible are trapped before stopping.
An “XY:” at the beginning of a line indicates the error, warning, check or other message has also been redirected to a geo-spatial layer (.gpkg, .shp or .mif) (see Section 14.4.5). Opening the layer in the GIS often provides a far more rapid location of the message within the model domain(s) than via other ways.
For more information on the .tlf, see the TUFLOW Wiki Log File (*.tlf) page.
14.4.1.1 HPC TLF and DT
Two additional files are produced when using TUFLOW HPC, the hpc.tlf and hpc.dt.csv.
The .hpc.tlf log file records the model timestep, control numbers and volume of water in the model at each timestep, as described in Section 14.1.2. It also shows repeated timesteps if the control number limits were exceeded or there is a significant change in control numbers (more than 20%). Sometimes repeated timesteps are of no concern, such as when a direct rainfall model has a sudden change in rainfall when transitioning through a rainfall histogram, or there is a warmup period with small or no flow rate before a large inflow - the adaptive timestepping is simply adjusting to the sudden change in flow conditions somewhere within the model. However, if there is a high occurrence of repeating timesteps when the boundary inflows are smooth, this could be an indicator of model instability and sensitivity tests reducing the timestepping intervals, using the Control Number Factor command, carried out. The total number of repeated timesteps is also recorded in the Simulation Summary of the .tlf file.
For more information on the hpc.tlf, see the TUFLOW Wiki Log File (*.tlf).
The hpc.dt.csv output provides a timeseries of the model timestep and the value of each control number at each timestep. The following columns are shown:
- iStep: Timestep display frequency, as mentioned in Section 14.1.
- tEnd: Simulation time at the end of timestep.
- dtStar: Desired timestep from the 2D component of the model.
- dt: Actual timestep, can be affected by the 1D timestep and output frequency.
- Nu: Courant Number.
- Nc: Shallow Wave Celerity Number.
- Nd: Diffusion Number.
- Eff: Efficiency value that represents the ratio of actual 2D timestep (dt) to possible 2D timestep (dtStar).
It is possible to view the minimum timestep (dt) in a map output format using
For more information of the hpc.dt.csv, see the TUFLOW Wiki HPC Model Review page.
14.4.2 TSF
A TUFLOW Summary File (.tsf file) is output to the same location as the .tlf file and provides a more concise summary of the simulation. This file can also be regularly updated during a simulation. By default, the summary output interval for a Classic model is set so there are 101 summary output values (for example, an interval of 180 seconds for a 5 hour model). For a HPC model the summary output interval is set to the Mass Balance Output Interval. If no Mass Balance Output Interval is specified, the lesser of the Map Output Interval and Time Series Output Interval is used.
Features are:
- The TSF Update Interval command can be used to control the interval in seconds to update the .tsf file while a simulation is running.
- The .tsf file has a TUFLOW control file style syntax and contains information on the solution scheme, hardware, primary simulation inputs, the simulation status, mass balance outputs, etc. Additional information will be added based on user feedback (please email support@tuflow.com if you have a suggestion).
The .tsf is updated as the model is running, users can open this file as the model is running to check on key features and progress. Table 14.1 provides an example of a .tsf. What is written to the .tsf is listed under ‘Column’ and then described under ‘Description’.
| Column | Description |
|---|---|
|
|
File path of the TUFLOW Control File (.tcf), see Section 4.1.5. |
|
|
File path of the TUFLOW Log File (.tlf), see Section 14.4.1. |
|
|
Name of the TUFLOW Build used, see Section 13.3.1. |
|
|
The Solution Scheme used. The options are TUFLOW Classic, or TUFLOW HPC. |
|
|
The Hardware used. The options are CPU or GPU, see Chapter 12. |
|
|
The GPU Device IDs. If multiple GPUs are used, see Section 12.3.4, they will be listed here. |
|
|
The computer name that the simulation is running on. |
|
|
Simulation status as one of the following:
|
|
|
Simulation time at time .tsf is opened (this updates as the simulation progresses). |
|
|
Simulation Start Time. |
|
|
Simulation End Time. |
|
|
Progress of the simulation at time .tsf is opened. |
|
|
Number of completed computational steps at time .tsf is opened. |
|
|
CPU Time at time .tsf is opened. |
|
|
Clock Time at time .tsf is opened. |
|
|
Approximate time remaining of simulation. |
|
|
Number of negative 1D depth reported at time .tsf is opened. |
|
|
If using TUFLOW HPC, the number of repeated timesteps due to High Control Numbers (HCN) at time .tsf is opened. |
|
|
If using TUFLOW HPC, the number of repeated timesteps due to Not a Number (NaN) occurring at time .tsf is opened. |
|
|
Number of WARNING 2550 reported at time of .tsf being opened. |
|
|
Number of WARNINGs prior to the simulation (i.e. during initialisation phase). |
|
|
Number of WARNINGs during the simulation (i.e. as the computations are happening). |
|
|
Number of CHECKs prior to the simulation (i.e. during initialisation phase). |
|
|
Number of CHECKs during the simulation (i.e. as the computations are happening). |
|
|
Volume at the start of the model. |
|
|
Volume at the end of the model. |
|
|
The current amount of volume that has entered the model. |
|
|
The current amount of volume that has left the model. |
|
|
The current volume error. |
|
|
The current percent of volume error. |
|
|
The current cumulative mass error reported in the model. |
|
|
The interval that the .tsf file is being updated. |
|
|
The number of summary values written. |
|
|
The volume in values for each interval. |
|
|
The volume out values for each interval. |
|
|
The change in volume values for each interval. |
|
|
The mass error values for each interval. |
|
|
The number of 1D nodes within the model, see Section 5.1. |
|
|
The number of 1D channels within the model, see Section 5.1. |
|
|
The number of active 2D cells. Typically set using a 2d_code polygon with attribute of ‘1’, see Section 7.2.1. |
|
|
The number of cells within the 2D domain, see Section 7.2.1. |
|
|
The number of inactive 2D cells (i.e. the total cells minus the active cells). |
|
|
The number of 2D domains. This will be one unless using the M2D functionality, see Section 10.7.2. |
|
|
The 2D domain cell size used, see Section 7.2.1. |
|
|
The 2D timestep. When using HPC this is a variable timestep and users should refer to the hpc.dt.csv , see Section 14.4.1.1. |
|
|
Time of the first map output. |
|
|
The time of the shortest Map Output Interval. |
14.4.3 Start Stats
A simulation start stats file (\<simulation_name>\_start_stats.txt) is output to the same location as the .tlf file. This file contains information on the total time and the time elapsed for each stage of model initialisation. This can be used to identify the stages causing slow simulation start-up, and allows the TUFLOW development team to prioritise development tasks to remove bottlenecks in the start-up through the use of XF files and other enhancements. If you have a problematic (slow starting) model, please email the _start_stats.txt and corresponding .tlf file through to support@tuflow.com.
14.4.4 Run Stats
A simulation run stats file (\<simulation_name>\_run_stats.txt) is also output to the same location as the .tlf file. This file contains the amount of time that TUFLOW spends in the 1D and 2D computations. At each mass balance output interval, the percentage of the total computational effort that TUFLOW has spent in 1D calculations, 2D calculations and other is output to the run_stats file. The “other” column includes a variety of tasks that are neither 1D or 2D computations, such as writing of outputs, and transfer of data to GPU (if running on GPU devices). The “other” column also includes time spent within an external 1D solver.
14.4.5 Messages
Error, warning, check and other useful messages that are output to the Console Window and log file are also output to a .csv file and geo-spatial layer (e.g. .gpkg, .shp or .mif depending of the GIS format set in the model). Messages output to the geo-spatial layer are those that can be geographically located within the model domains. These messages layers are output in the Log Folder.
The three levels of messages generated in increasing order of severity are:
- CHECK: A check indicates that something unusual occurred and may, for example, indicate erroroneous data. For example a breakline failed to modify any cell elevations (CHECK 2079).
- WARNING: A warning is more severe than a check message, but the simulation will still progress. For example, a Manning’s n value of 0.001 would be considered outside typical industry ranges and will trigger WARNING 2218.
- ERROR: An error indicates that the simulation is unable to continue. For example, if no active cell is found within a source area boundary an ERROR 2014 will occur and the simulation will terminate.
This feature allows rapid identification of the error location within the GIS environment of data input errors and simulation instabilities and potential problems. Using this feature can save considerable time when setting up and checking new models.
Of note is that some messages can be changed from their default setting in situations where the modeller has determined that the message level does not need to be enforced, or enforced to a higher level.
A message numbering system has been adopted, prefixing all warnings with a four digit number. These numbers may be used to cross-reference the warning with a message database that is stored on the TUFLOW Wiki TUFLOW Messages page. The database contains detailed information on the CHECK, WARNING or ERROR to help check/resolve the issue. Each message falls into one of the following message categories:
- 0xxx warning messages refer to errors that occur in neither the 1D or 2D domains.
- 1xxx warning messages refer to errors that occur in the 1D domains.
- 2xxx warning messages refer to errors that occur in the 2D domains.
- 3xxx warning messages refer to errors that are unique to TUFLOW HPC.
- 4xxx warning messages refer to errors that are unique to Advection Dispersion module.
- 6xxx warning messages refer to errors that occur in the EPA SWMM 1D domain.
As of the QGIS TUFLOW Plugin Version 3.9, it is possible to filter messages by code ID, as shown in Figure 14.3. For more information see the QGIS TUFLOW Plugin Changelog.
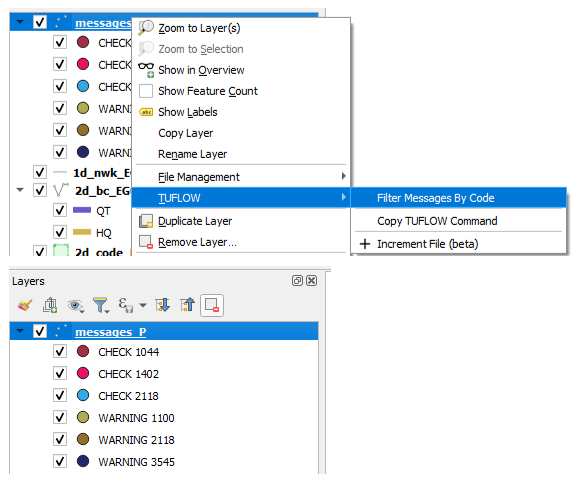
Figure 14.3: Filter by Code Number
14.4.6 GIS Workspaces
A QGIS workspace (.qgs) and MapInfo workspace (.wor) is automatically created for every simulation. They are named <tcf_filename>.qgs / .wor and are written to the same folder as the .tlf file. The workspace contains all GIS layers used as input to the simulation, and is an excellent way of ascertaining the GIS layers used to set up a model, particularly large models with many GIS inputs, or those with multiple events or scenarios.
Opening the .qgs file in QGIS will open all GIS input and output check layers (.gpkg, .shp and/or .mif). Note that the visibilities of the output layers are unchecked so that the display time is quick.
The .wor file, when opened in MapInfo, simply opens the .tab layers. No Map or Browser windows are automatically opened. If the simulated model contains any other vector formats (e.g. .gpkg or .shp files), these are not opened.
For ArcMap users, the .mxd files cannot be directly written by TUFLOW, as the format is proprietary. However, the ArcTUFLOW Toolbox can be used to load the simulation input files into ArcMap.