1.2 Features
Several key features have been included in the design of TUFLOW CATCH to support its use. Some are listed below.
- Simulation engine. To affect whole-of-catchment simulation, TUFLOW CATCH links and augments the power and functionality of two existing TUFLOW engines. This means that the decades of development, expertise and rigour embedded in the TUFLOW suite of products is exploited by TUFLOW CATCH. These existing TUFLOW engines are:
- TUFLOW HPC: Fixed grid simulation of surface and subsurface catchment hydrology, hydraulics, pollutant export and transport
- TUFLOW FV: Flexible mesh simulation of receiving waterway hydrodynamic, advection dispersion, heat, sediment transport, water quality and particle tracking
Conceptually, TUFLOW CATCH links and coordinates TUFLOW HPC and TUFLOW FV as in Figure 1.1. TUFLOW HPC coverage is represented by the fixed grid iconography, and TUFLOW FV is shown as contained within the enclosing thick brown boundary line. This intention is that this figure conveys the ability of TUFLOW CATCH (in its most advanced configuration) to use advanced numerical techniques (free of top-down lumping assumptions) to seamlessly simulate water and pollutant dynamics from top of catchment to receiving waterway outlet. TUFLOW CATCH can also be configured to simulate other (less advanced but still important and relevant) combinations of environmental flows and pollutant transport processes (see Section 1.3).
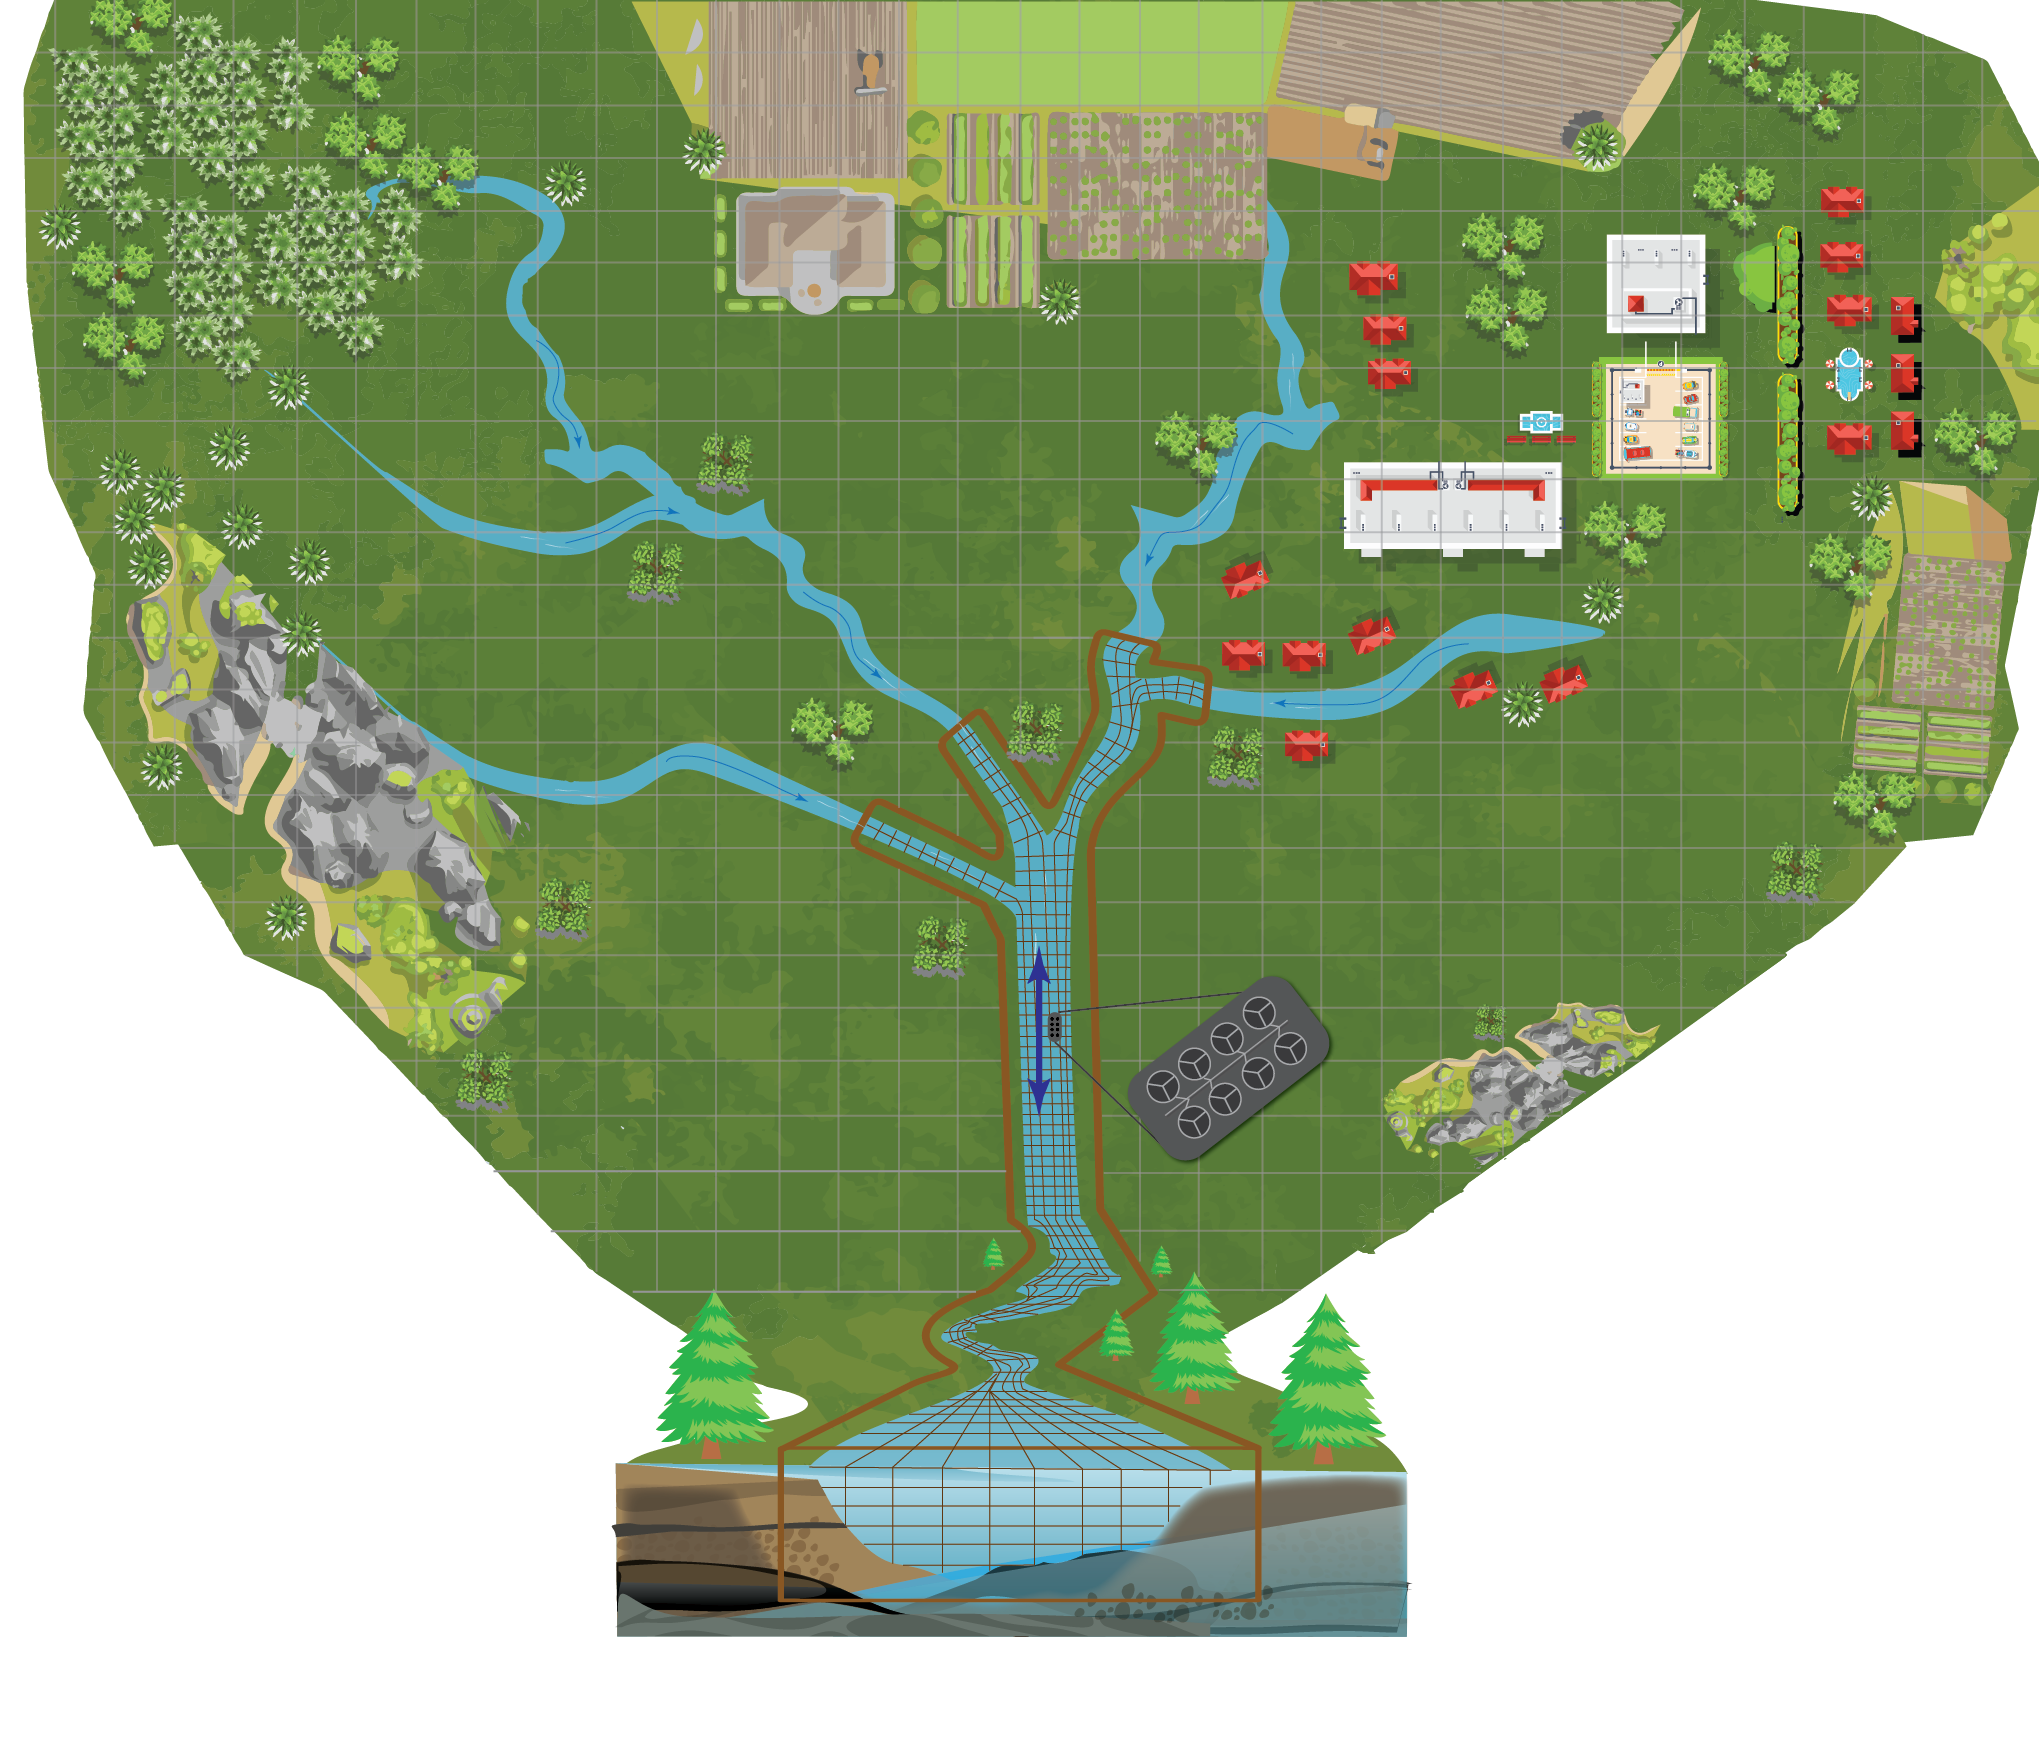
Figure 1.1: Conceptual arrangement of TUFLOW CATCH engines
- Pollutant Export. TUFLOW CATCH adds pollutant export functionality to TUFLOW HPC. Pollutants are able to be liberated on a cell by cell basis and under a range of user-selectable algorithms (accumulation-washoff or shear stress based, for example), and then routed as surface and/or subsurface flows and concentrations, via solution of the equations of motion and transport, rather than using lumped top-down average assumptions
- Automatic linkage When required, TUFLOW CATCH automatically links the bottom of catchment TUFLOW HPC predictions (for both flow and pollutant concentrations) to the upstream of TUFLOW FV’s model domain to present a single integrated modelling platform to the user, with no need for manual handling or other post/pre processing. To affect this, TUFLOW CATCH automatically
- Determines the spatial locations where surface and subsurface waters drain to the user defined TUFLOW FV mesh (or GIS polygon if TUFLOW FV simulation is not selected) and designates these as inflow locations to TUFLOW FV (or simply a single exit point if a polygon is specified), and then
- Writes the TUFLOW HPC predictions as fully formatted TUFLOW FV inflow boundary conditions files and blocks, either as nodestrings or elements. If a downstream polygon is specified then timeseries of summed outlet flows and masses are reported
- Command syntax. TUFLOW CATCH uses familiar TUFLOW style
command == argument(s) syntax that has a long established pedigree within all other TUFLOW products - Flexibility of constituents. TUFLOW CATCH, when combining TUFLOW HPC and TUFLOW FV in full can simulate any constituents that are initialised in TUFLOW FV, across all its modules, including sediment transport and water quality. TUFLOW CATCH can also run TUFLOW HPC in pollutant generation mode only (without activating TUFLOW FV, i.e. the ‘pollutant export’ configuration, see Section 1.3), and in this instance, users can specify any pollutants they wish to simulate (e.g. ‘PFAS’ or ‘DDT’ etc.) - these do not need to be simulated by TUFLOW FV or its modules
- Log file user feedback. TUFLOW CATCH simulations generate TUFLOW HPC and TUFLOW FV log files as per usual that report all simulation configuration details for review in a single consolidated location
- Results viewing. TUFLOW CATCH has its own freely available QGIS plugin to support viewing and interrogation of combined TUFLOW HPC and TUFLOW FV results, as a single data set, such as Figure 1.2
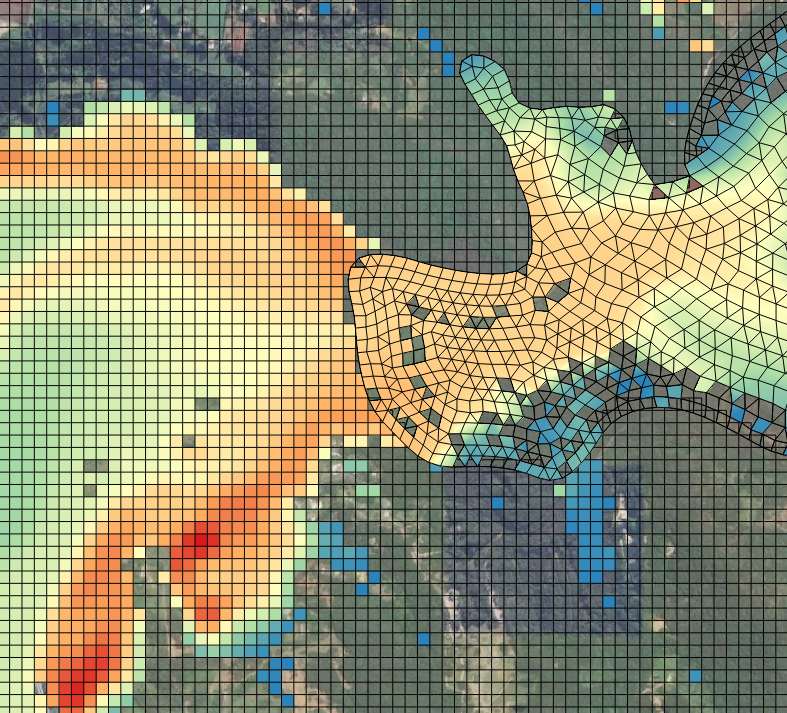
Figure 1.2: Example of using the QGIS TUFLOW CATCH plugin to view combined results