S.6 Example results
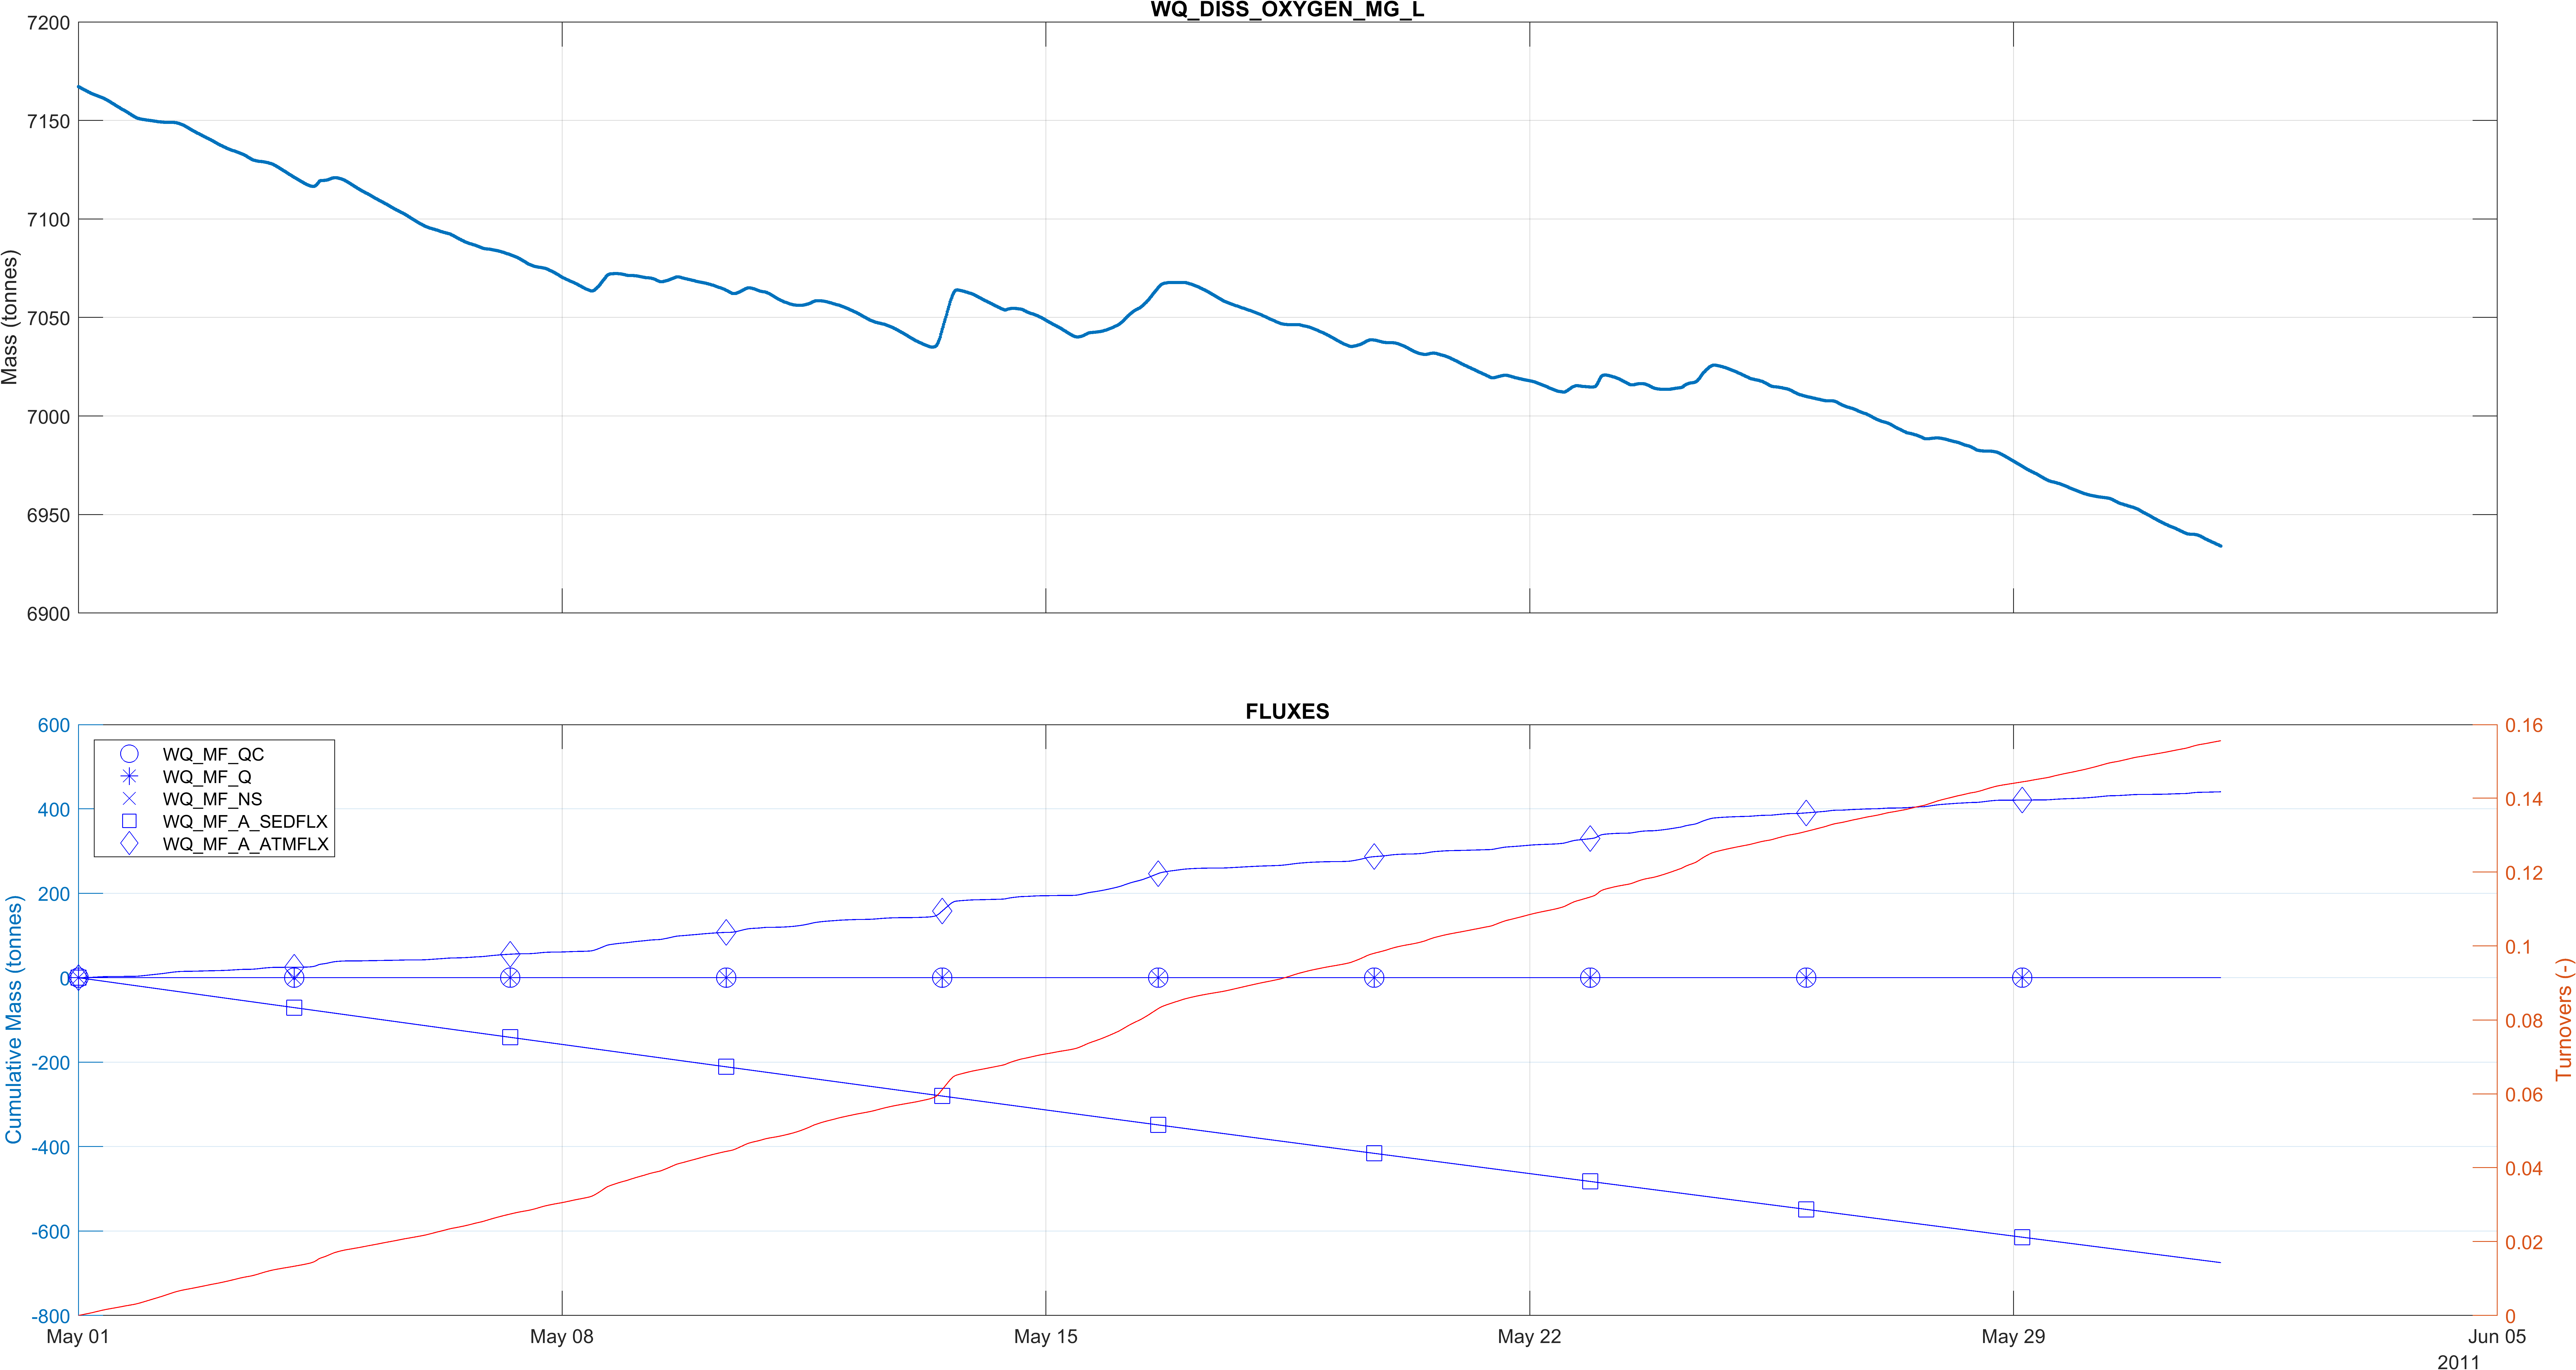
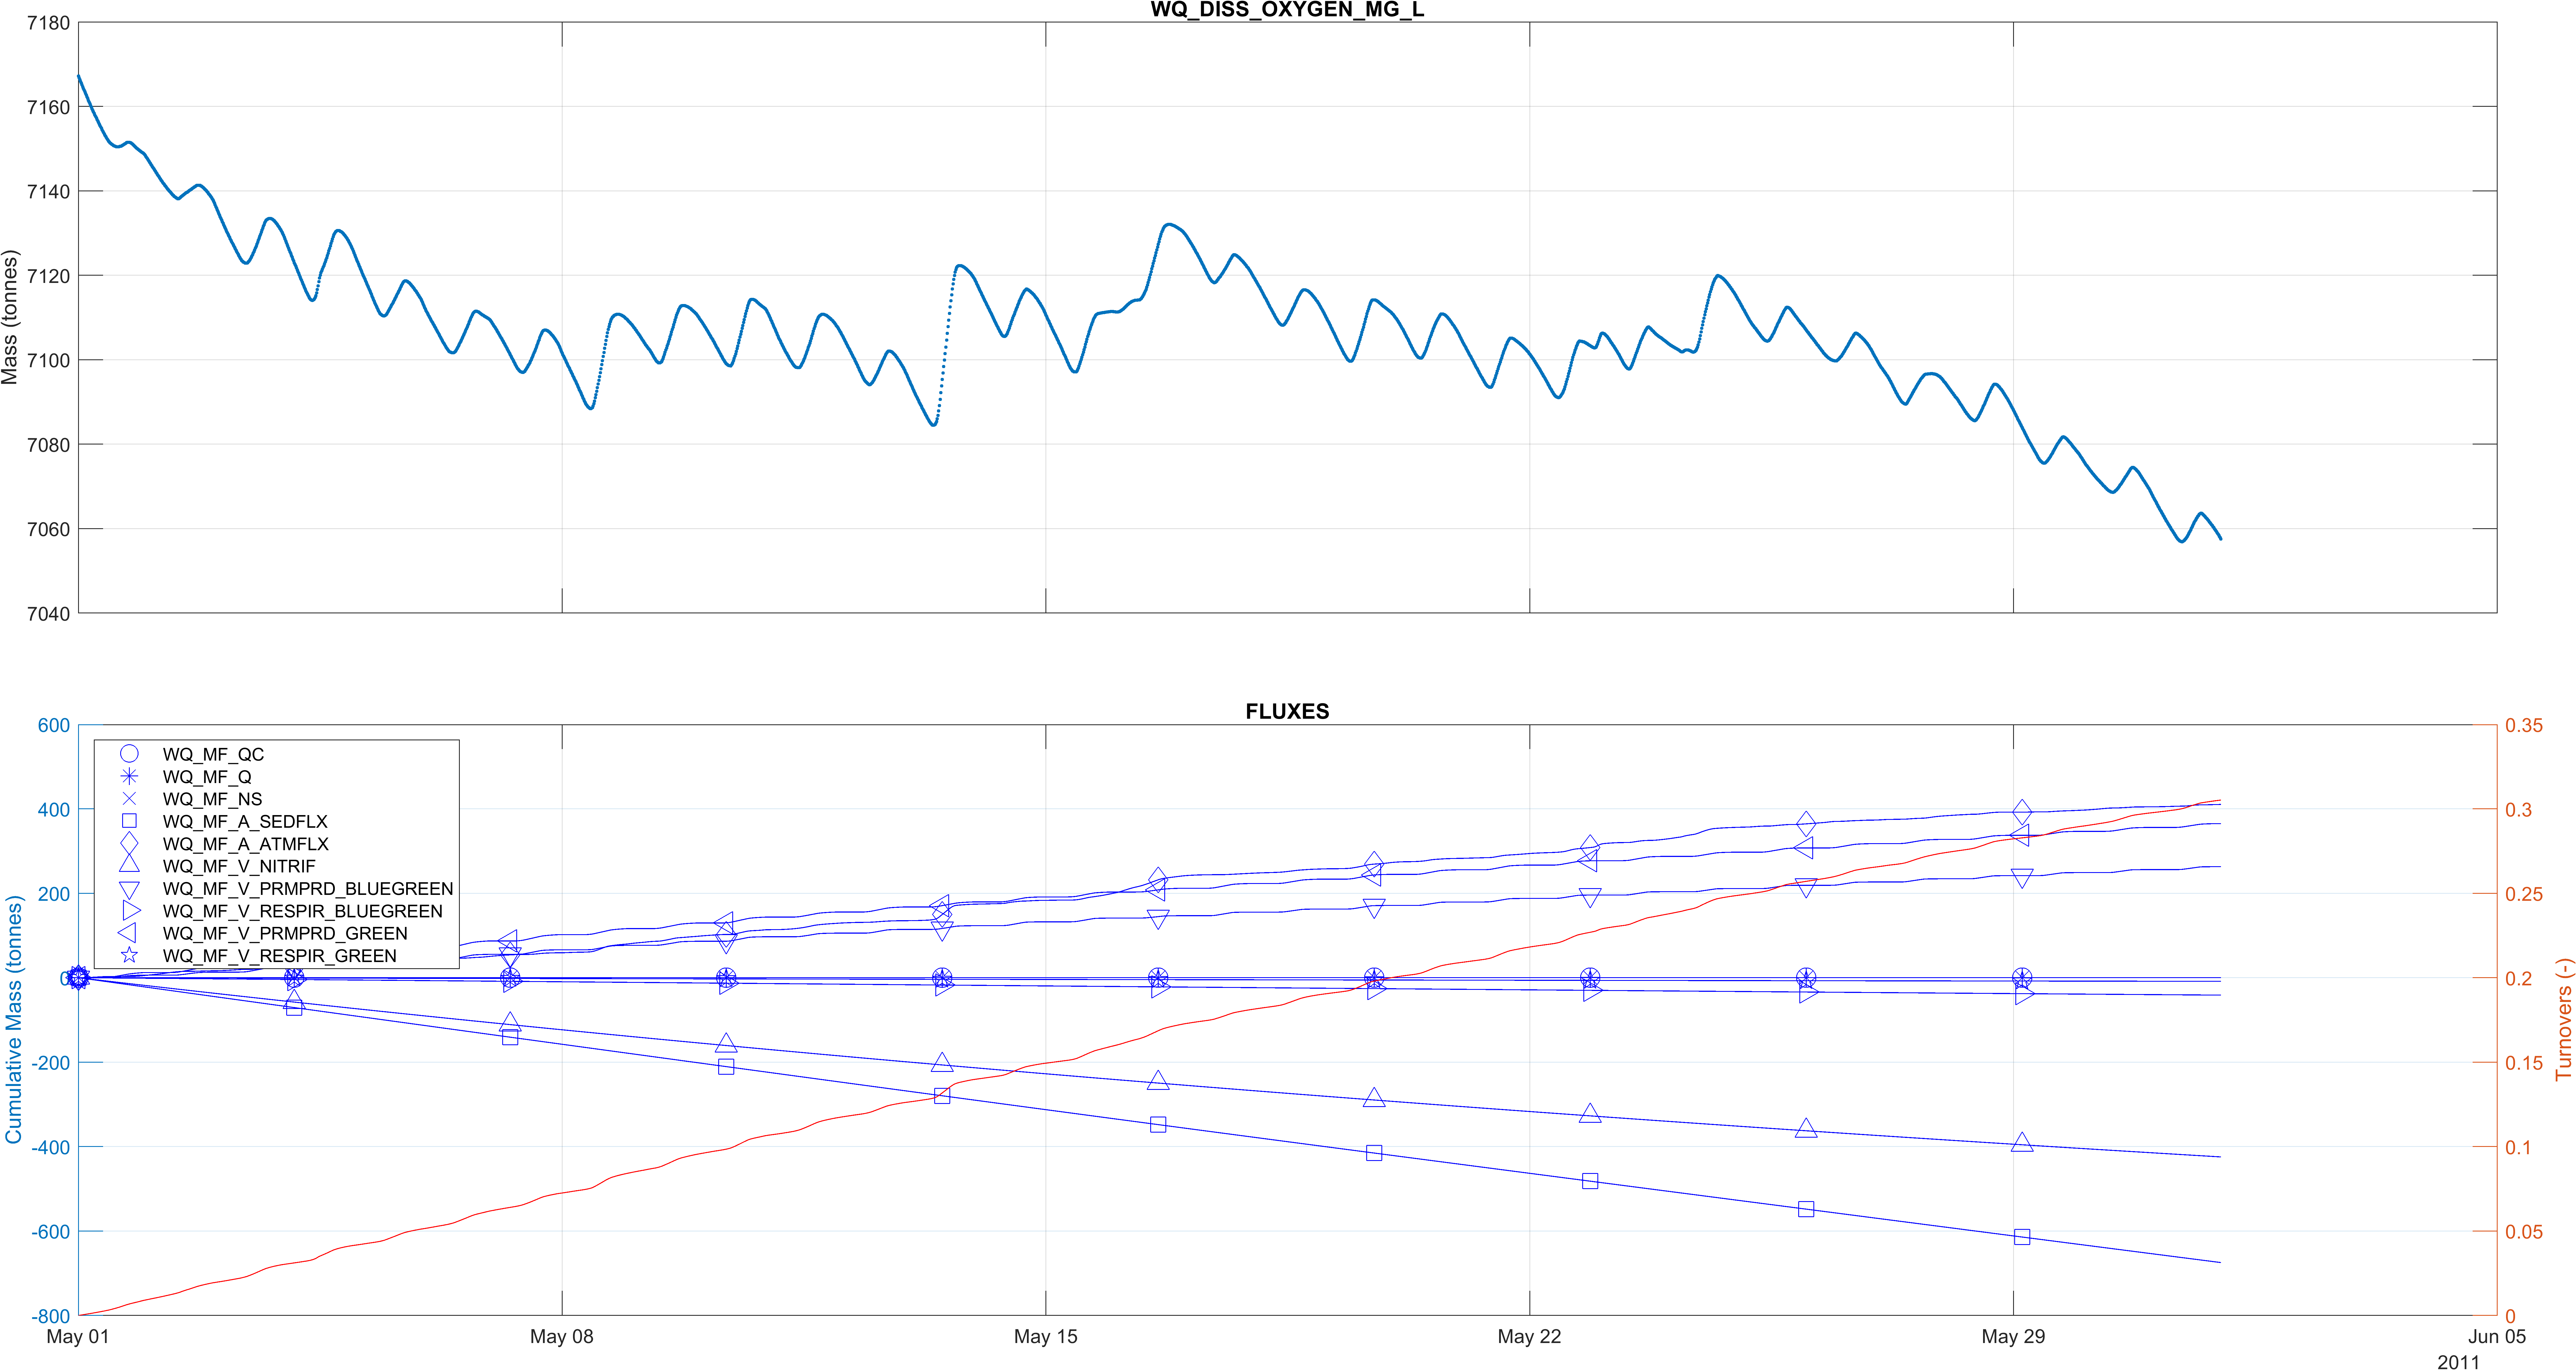
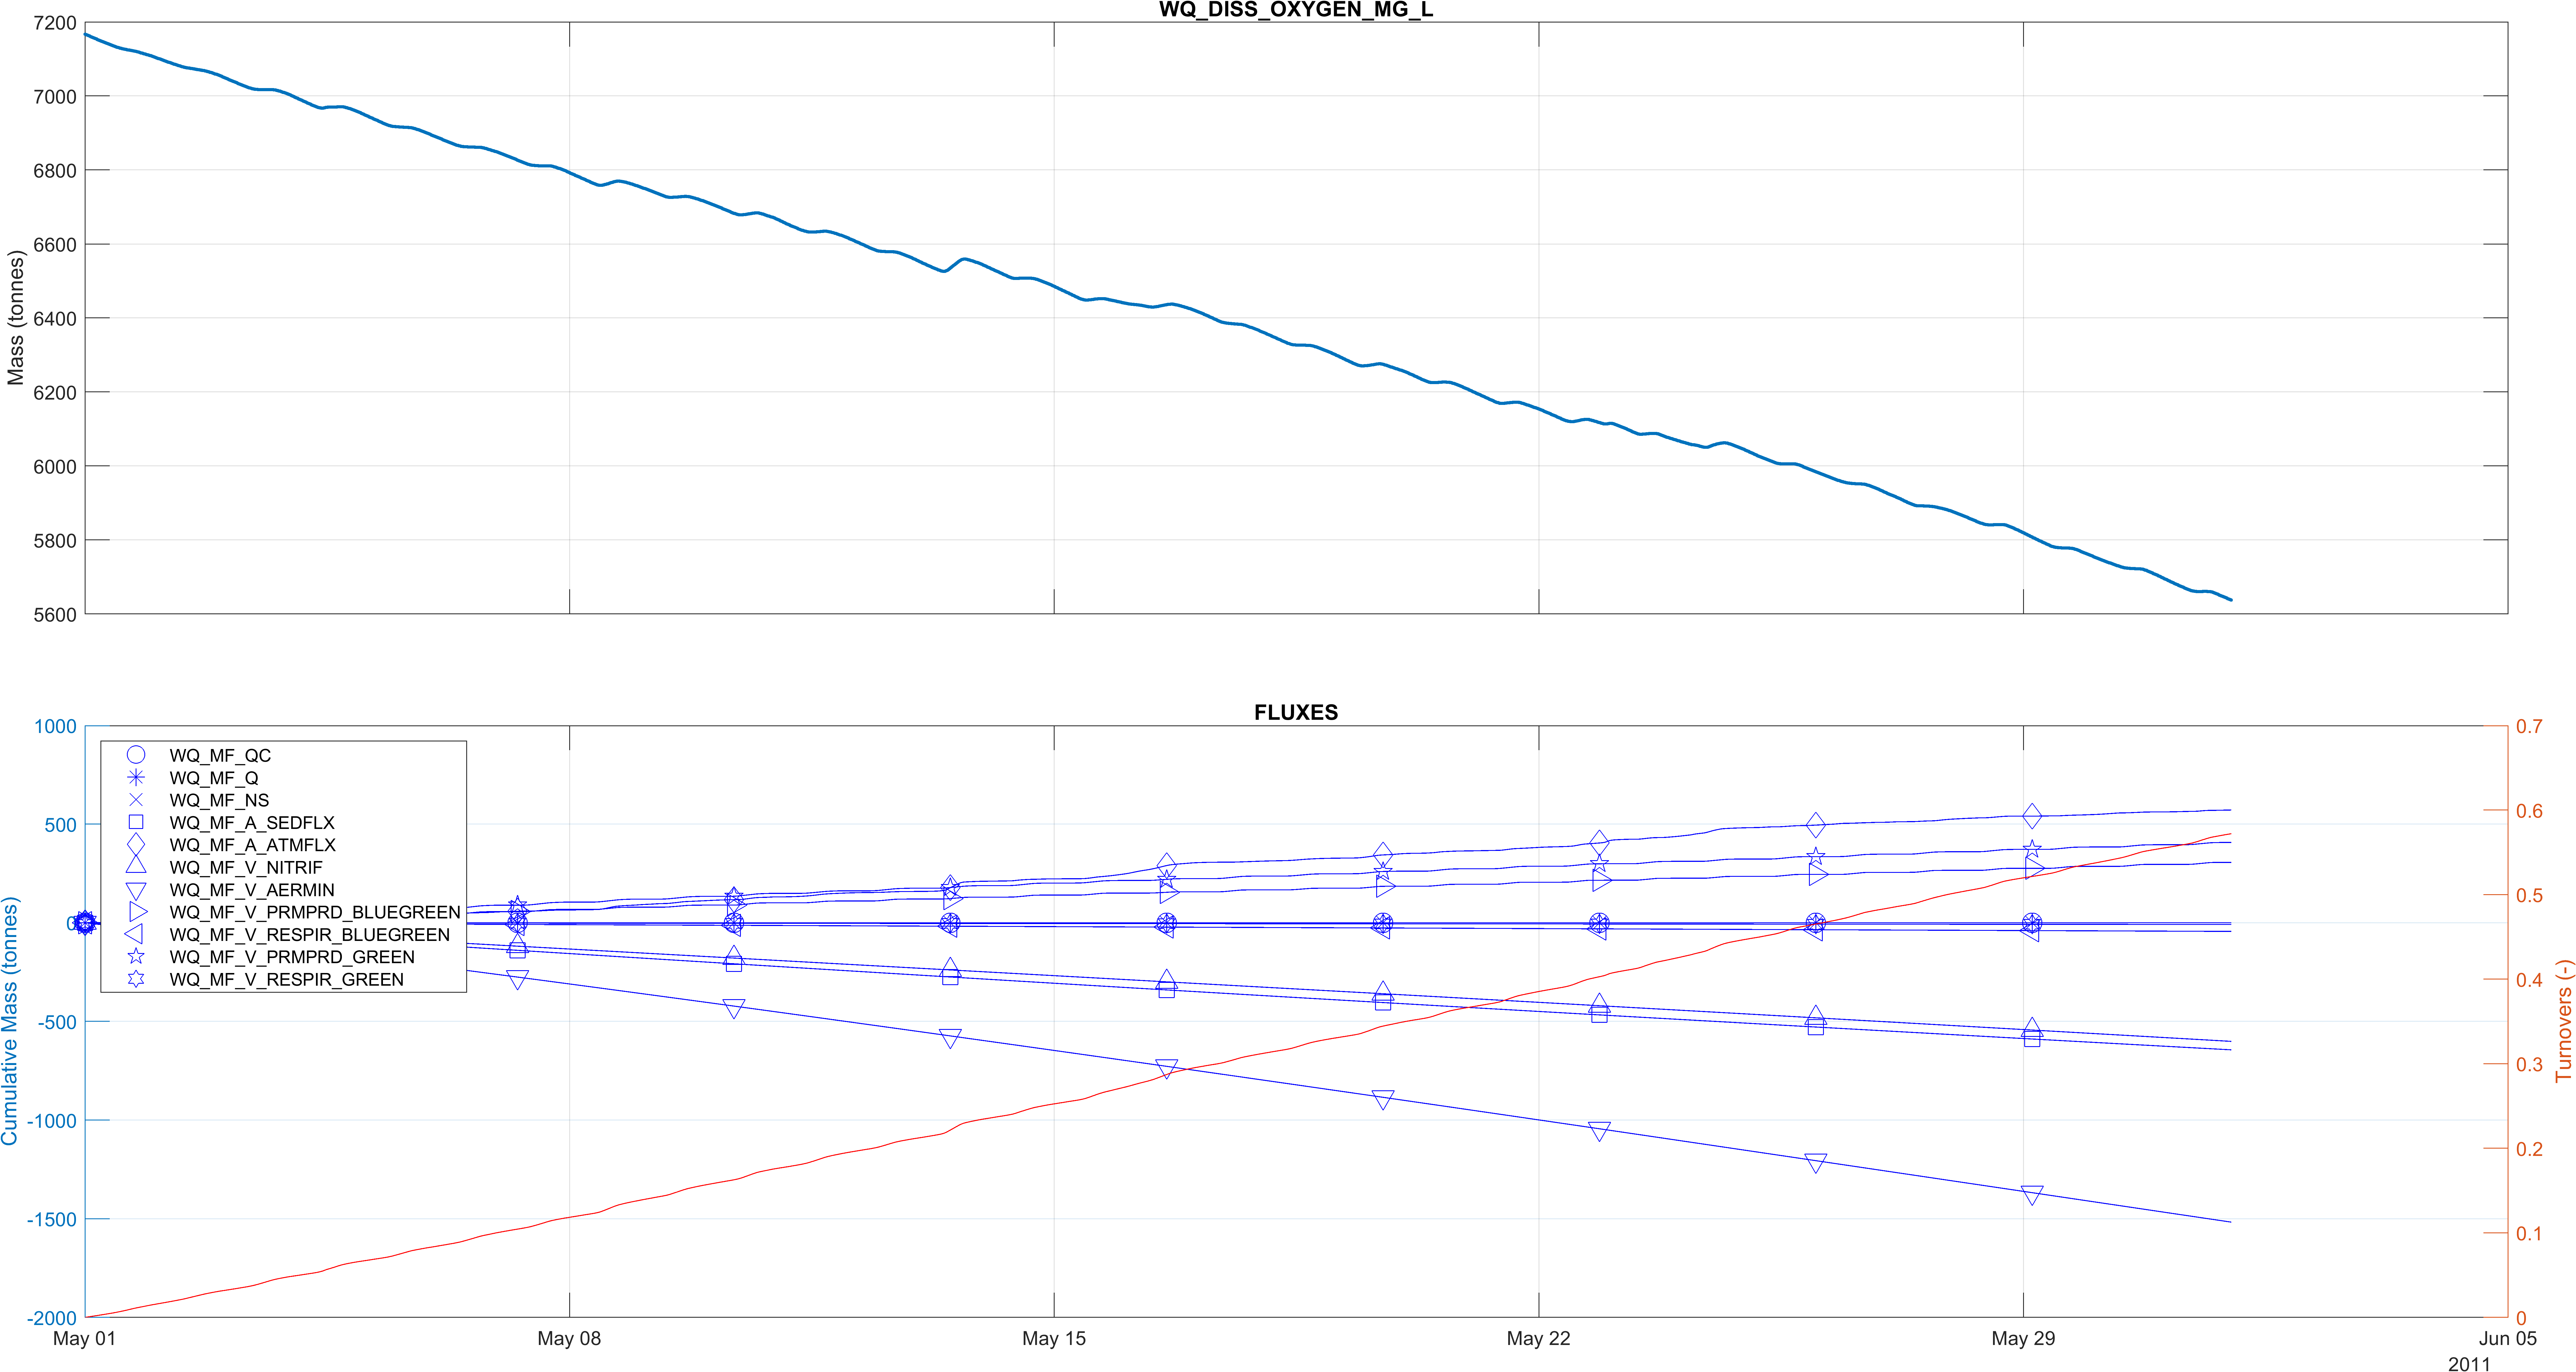
The following figures provide an example of the progressively more complex dissolved oxygen dynamics that characterise the DO, Inorganics and Organics Simulation Classes. The top pane in each figure is a timeseries of the total mass of dissolved oxygen and the bottom pane plots the cumulative fluxes written to the respective ’*_MASSBALANCE_DISS_OXYGEN_MG_L.csv’ mass balance output files. The number of Turnovers is also plotted on the secondary vertical axis of the lower plot, in orange. No post processing has been performed.

Figure S.2: Dissolved oxygen mass balance output: DO Simulation Class. Percentage error: 0.006%

Figure S.3: Dissolved oxygen mass balance output: Inorganics Simulation Class. Percentage error: 0.017%

Figure S.4: Dissolved oxygen mass balance output: Organics Simulation Class. Percentage error: 0.022%
