pytuflow.NCMesh.mesh_dataset#
- NCMesh.mesh_dataset(mesh_geometry='', time=-1, datasets=(), location_ref='local', reindex=False)#
Returns the mesh dataset as a pyvista.PolyData instance.
Warning
The method is only available when using pyvista mesh geometry drivers. This is the driver that PyTUFLOW uses in a Python environment. It will not be available if using PyTUFLOW in a QGIS environment.
- Parameters:
mesh_geometry (str, optional) – The data type to use for the mesh geometry, e.g.
"water level". If not provided, the base mesh geometry will be used e.g. this will be the"Bed Elevation"for XMDF results.time (float | datetime, optional) – The time to export the data for. This is required if using a temporal dataset or mesh_geometry.
datasets (list, optional) – Additional datasets to add to the mesh. These do not change the mesh geometry, however can be used when plotting to assign a colour ramp.
location_ref (Mesh | str, optional) –
The location reference to use. The options are:
"local"- Default. Use the mesh local coordinate system where the X,Y origin (0,0) is at the centre of the dataset."global"- Use the global coordinate system i.e. converts back to the original spatially referenced results.Mesh- Another mesh object. The returned pyvista.PolyData object will be converted to the local coordinate system of the providedMesh. This allows mesh objects to be aligned without having to use a global coordinate system.
reindex (bool, optional) – Whether to reindex the pyvista.PolyData object before returning it. Reindexing in this case is removing inactive cells.
- Returns:
The mesh dataset.
- Return type:
pyvista.PolyData
Examples
Plot the bed elevation and max water level from an XMDF results.
>>> import pytuflow
>>> import pyvista as pv
>>> res = pytuflow.XMDF('examples/datasets/xmdf/EG15_001.xmdf')
>>> mesh = res.mesh_dataset()
>>> wl_mesh = res.mesh_dataset('max water level', reindex=True) # reindex removes inactive cells
>>> pl = pv.Plotter() # init the plotter
>>> _ = pl.add_mesh(mesh, scalars='bed level', cmap='Spectral_r', smooth_shading=True)
>>> _ = pl.add_mesh(
...         wl_mesh,
...         scalars='max water level',
...         cmap='Blues',
...         smooth_shading=True,
...         opacity=0.75,
...         show_scalar_bar=False
...     )
>>> pl.set_scale(zscale=5) # exagerate the z scale
>>> pl.enable_terrain_style() # has no effect on interaction window below, but will work in other contexts
>>> pl.show()
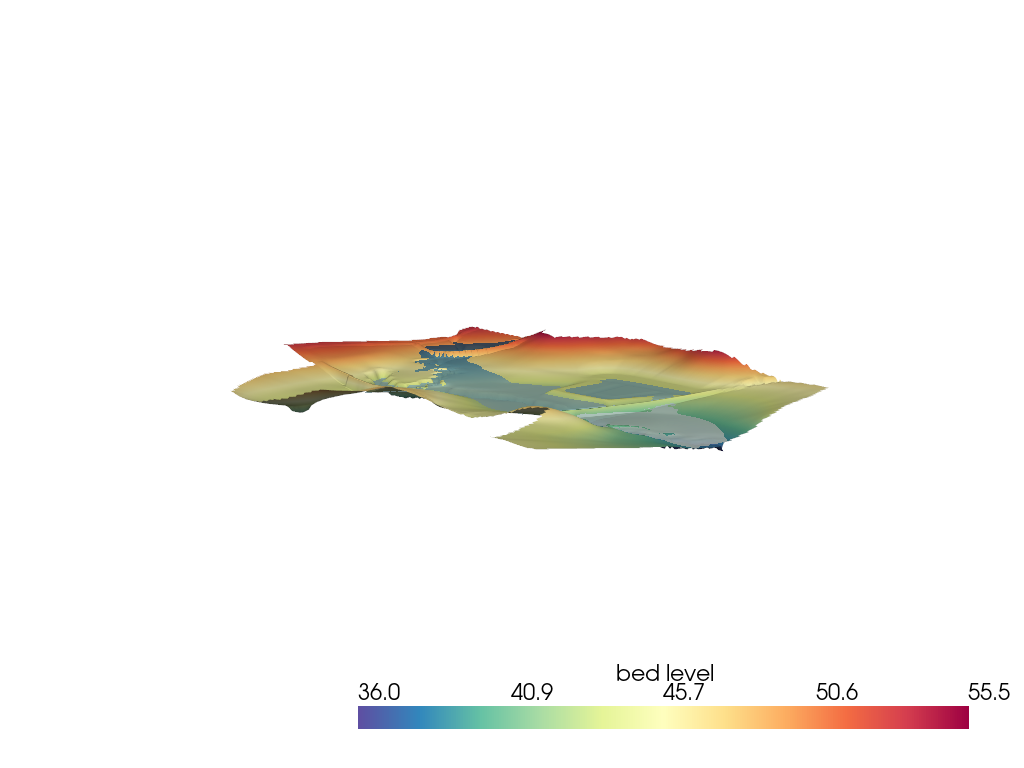
Left-click = rotate, Ctrl+left = rotate locked to camera, Shift+left = pan
Animate water level through time using a time slider.
import numpy as np
import pytuflow
import pyvista as pv

res = pytuflow.XMDF('/path/to/result.xmdf')
times = res.times()

# static bed-level mesh used as the base surface
bed_mesh = res.mesh_dataset()

# water-level mesh initialised at the first time step
wl_mesh = res.mesh_dataset('water level', times[0])

pl = pv.Plotter()
pl.set_scale(zscale=5)
_ = pl.add_mesh(bed_mesh, scalars='bed level', cmap='Spectral_r', smooth_shading=True)
_ = pl.add_mesh(wl_mesh, scalars='water level', cmap='Blues', smooth_shading=True, opacity=0.75)

def update_time(time_val):
    # snap slider value to the nearest available time step
    idx = int(np.argmin(np.abs(np.array(times) - time_val)))

    # don't need to re-copy mesh, extracting the surface is enough
    surf = res.surface('water level', times[idx])

    # update geometry and scalars in-place to avoid re-adding the actor
    wl_mesh.points[:,2] = surf['value']
    wl_mesh.point_data['water level'][:] = surf['value']

slider = pl.add_slider_widget(update_time, [times[0], times[-1]], value=times[0], title='Time')

# the default callback behaviour is only when the slider is released
# if you want to add a callback each time the slider is changed, add the following line
slider.AddObserver('InteractionEvent', lambda w, e: update_time(w.GetRepresentation().GetValue()))
pl.enable_terrain_style()
pl.show()
Example of using a time slider to dynamically update the plot
Render a movie. This example also shows how to add vectors to the map.
This example will require installing
imageio[tifffile]andimageio-ffmpeg:pip install imageio[tifffile] imageio-ffmpegimport pytuflow import pyvista as pv from pathlib import Path SCALE = 5. DATASETS = ['water level', 'velocity', 'vector velocity'] res = pytuflow.XMDF('/path/to/result.xmdf') times = res.times() # static bed-level mesh used as the base surface bed_mesh = res.mesh_dataset() # result datasets - these can all be collected together # as they can share the water level mesh geometry res_mesh = res.mesh_dataset('water level', times[0], datasets=DATASETS) # retrieve the min/max velocity for the colour bar vel_min = 0. vel_max = res.maximum('velocity') # setup the arrow geometry # scale the arrow geometry to counter # the plot scaling that is applied later arrow_geom = pv.Arrow().scale([1., 1., 1 / SCALE]) arrows = res_mesh.glyph( orient='vector velocity', scale='velocity', geom=arrow_geom, factor=5 ) # setup the plotter pl = pv.Plotter(off_screen=True) pl.set_scale(zscale=5) # add the meshes to the plotter pl.add_mesh( bed_mesh, scalars='bed level', cmap='Spectral_r', smooth_shading=True, show_scalar_bar=False ) pl.add_mesh( res_mesh, scalars='water level', cmap='Blues', smooth_shading=True, opacity=0.75, show_scalar_bar=False ) pl.add_mesh( arrows, cmap='coolwarm', clim=(vel_min, vel_max) ) # this will need to be customised for your model # the best way is to use an interactive plot first and find a good spot # and then retrieve (and copy) the position in python with pl.camera_position pl.camera_position = [ (564.2798, 488.9518, 583.4595), (-33.3634, 91.8160, 175.7947), (-0.3921, -0.3020, 0.8690) ] # open the movie file and loop through all the timesteps pl.open_movie('/path/to/movie.mp4', framerate=10) for time_ in times: updated_mesh = res.mesh_dataset('water level', time_, datasets=DATASETS) res_mesh.points[:, 2] = updated_mesh.points[:,2] res_mesh.point_data['water level'][:] = res_mesh.points[:, 2] new_arrows = updated_mesh.glyph( orient='vector velocity', scale='velocity', geom=arrow_geom, factor=5 ) arrows.copy_from(new_arrows) pl.write_frame() print(f'Rendered frame {time_}') pl.close()
Output of the rendered movie with velocity vectors
The above example requires the camera position, the best way to obtain this is to set a keyboard shortcut to copy the camera position to the clipboard. This way the camera can be positioned in the plotter, then the position can be obtained and pasted into the animation script.
import pytuflow
import pyvista as pv
import tkinter as tk

def copy_camera_to_clipboard():
    formatted_code = f"camera_position = {pl.camera_position}"

    # Push the string into the system clipboard
    root = tk.Tk()
    root.withdraw()  # Hide the main window
    root.clipboard_clear()
    root.clipboard_append(formatted_code)
    root.update()  # Keep it in memory after closing
    root.destroy()

res = pytuflow.XMDF('/path/to/result.xmdf')
mesh = res.mesh_dataset()
wl_mesh = res.mesh_dataset('max water level', reindex=True) # reindex removes inactive cells
pl = pv.Plotter() # init the plotter
_ = pl.add_mesh(mesh, scalars='bed level', cmap='Spectral_r', smooth_shading=True)
_ = pl.add_mesh(
        wl_mesh,
        scalars='max water level',
        cmap='Blues',
        smooth_shading=True,
        opacity=0.75,
        show_scalar_bar=False
    )
pl.set_scale(zscale=5) # exagerate the z scale
pl.enable_terrain_style()

# setup the keyboard shortcut so that "c" copies the camera position
pl.add_key_event("c", copy_camera_to_clipboard)

pl.show()