pytuflow.LP2D#
- class LP2D(fpath, gis_fpath=None)#
Bases:
LongProfileBaseClass for handling results from the
2d_lpoutput from TUFLOW Classic/HPC. The class supportssection()extraction along the line. Points are automatically created at each distance value in the CSV, enablingtime_series()extraction at specific chainage locations.The output can be initialised with any number of
2d_lpoutput files as long as they are for the same location. That is, TUFLOW writes a CSV file for each location and for each data type. Each location must be in its own instance, however data types can be grouped into a single instance.The GIS file (the
2d_lpinput that generated the output) can be optionally provided. In this case “Label” attribute field will be used, otherwise the file name excluding the result type will be used as the line label. It also provides spatial coordinates for both the line and the generated points.- Parameters:
fpath (PathLike | Sequence[PathLike]) – The CSV file path(s) to the 2d_lp output CSV file(s). Each file should be for the same location (i.e. same line label) but can be for different data types. The data type and the line label will be determined from the file name.
gis_fpath (PathLike, optional) – The file path to the GIS file that corresponds to the
2d_lpoutput. This is optional, but if not provided the class won’t be able to determine the line label from the CSV file. It can also provide a spatial location for the line and the created points.
Examples
Loading a result and extracting the maximum profile:
>>> from pytuflow import LP2D
>>> import matplotlib.pyplot as plt
>>> lp = LP2D('/path/to/model_LP_NAME_H.csv')
>>> df = lp.section('model_LP_NAME', ['bed level', 'max h'], -1)  # time can be a dummy value for static results
>>> df
   offset  branch_id     node_string  bed level   max h
0    2.07          0  EG02_012_LP_01     44.277  49.863
1    8.31          0  EG02_012_LP_01     44.150  49.861
2   14.55          0  EG02_012_LP_01     44.192  49.874
3   20.79          0  EG02_012_LP_01     48.128  49.149
4   27.03          0  EG02_012_LP_01     44.007  46.415
5   33.28          0  EG02_012_LP_01     43.918  47.091
6   39.52          0  EG02_012_LP_01     43.837  47.095
7   45.77          0  EG02_012_LP_01     43.866  47.073
8   52.02          0  EG02_012_LP_01     43.770  47.041
>>> df.plot(y=['bed level', 'max h'])
>>> plt.show()
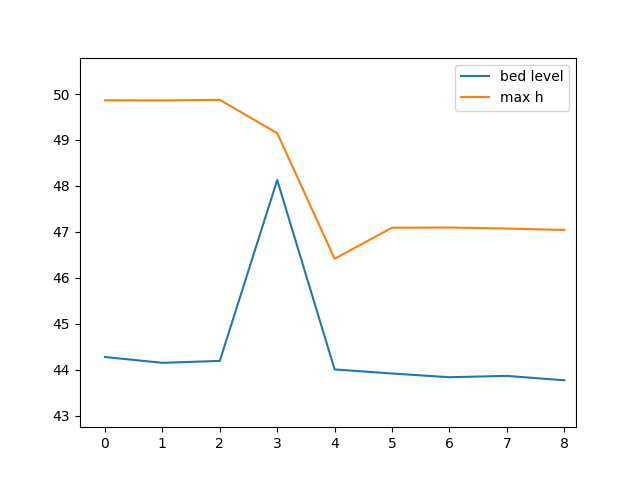
The below is a script that will generate a water level profile plot that has an interactive slider that will dynamically update the water level based on the time.
from pytuflow import LP2D
from matplotlib.widgets import Slider

# Result location - update accordingly
RESULT = '/path/to/model_LP_NAME_H.csv'

# initialise subplots
fig, ax = plt.subplots()

# initialise the LP2D class and initialise
# the section dataframe for the first time step
res = pytuflow.LP2D(RESULT)
df = res.section(res.name, ['bed level', 'h', 'max h'], 0)

# generate plot lines
z_line, = ax.plot(
    df['offset'],
    df['bed level'],
    label='bed level',
    color='black'
)
h_line, = ax.plot(
    df['offset'],
    df['h'],
    label='h',
    color='blue'
)
max_h_line, = ax.plot(
    df['offset'],
    df['max h'],
    label='max h',
    color='blue',
    linestyle='dashed'
)

# plot house-keeping
ax.legend()
ax.grid()
ax.set_xlabel('Distance')
ax.set_ylabel('Elevation')

# adjust the main plot to make room for the sliders
fig.subplots_adjust(bottom=0.25)

# Make a horizontal slider to control the time
time_ax = fig.add_axes([0.25, 0.1, 0.65, 0.03])
time_slider = Slider(
    ax=time_ax,
    label='Time',
    valmin=res.times()[0],
    valmax=res.times()[-1],
    valstep=res.times()[1] - res.times()[0],
    valinit=res.times()[0],
)

# callback that updates and extracts water level data
def time_updated(time_val):
    df = res.section(res.name, 'h', time_val)
    h_line.set_ydata(df['h'])
    fig.canvas.draw_idle()

# register the update function
time_slider.on_changed(time_updated)

plt.show()
- __init__(fpath, gis_fpath=None)#
- Parameters:
fpath (Path | str | Sequence[Path | str])
gis_fpath (Path | str)
Methods
Returns all the available data types (result types) for the given filter.
Returns all the available IDs for the given filter.
Returns a DataFrame containing the maximum values for the given data types.
Returns a DataFrame containing the long plot data for the given location(s) and data type(s).
Returns a time-series DataFrame for the given location(s) and data type(s).
Returns all the available times for the given filter.
Attributes
The provider for the long profile output
Result objects
Number of nodes
Number of node strings
The result name
Does the result have an inherent reference time.
The reference time for the output