pytuflow.GridMesh.add_dataset#
- GridMesh.add_dataset(dataset)#
Adds an additional dataset to the mesh class. Adding a dataset can be a quick way of appending results onto an existing result class without having to load the mesh geometry (which is typically the slowest aspect of loading a result).
The incoming dataset must have identical geometry and must match the existing format of the existing datasets e.g. only a
.xmdffiles can be added to anotherXMDFresult. Crucially, this means that DAT cannot be loaded onto an XMDF, even if they share the same .2dm file.The incoming dataset will be loaded into a driver based on the existing settings e.g. if the existing XMDF is using
h5pythen the new dataset will also useh5py.Note
This functionality is not intended as a way to quickly reload results onto an already instantiated mesh. The class will return the first instance of a given result type name, which will be the original mesh result. This means that if a dataset is added with data type names that exist already in the mesh instance, it will not overwrite the original instance’s datasets.
Note
QGIS drivers do not allow a NetCDF mesh to be appended to another NetCDF mesh. PyTUFLOW will allow it and the subsequent behaviour in PyTUFLOW in respect to interacting the the mesh output will be identical regardless of this. However, the mesh geometry will be required to be loaded again so the performance gain will be lost in this situation.
- Parameters:
dataset (PathLike) – The path to the dataset for adding
Examples
A nice use case for this functionality is if you have results from a TUFLOW FV WQ module simulation. The WQ module writes out into a separate
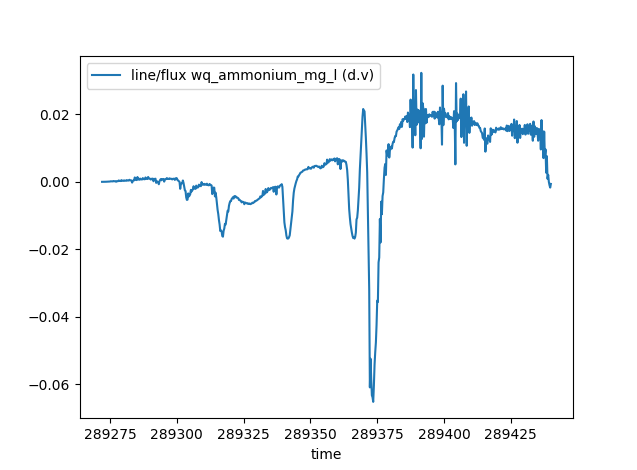
.ncfile. This can be loaded onto the TUFLOW FV hydrodynamic results. This will save the effort of loading identical geometry and also combines the results into a single class instance. This can have additional benefits such as being able to estimate the mass flux of a WQ constituent, which usually would not be possible as the velocity is stored in the hydrodynamic result file.>>> from pytuflow import NCMesh >>> res = NCMesh('/path/to/hydrodynamic-results.nc') >>> res.add_dataset('/path/to/wq-results.nc') >>> df = res.flux('/path/to/flux-line.shp', 'wq_ammonium_mg_l') >>> df line/flux wq_ammonium_mg_l (d.v) time 289272.00 0.000000 289272.25 0.000000 289272.50 0.000009 289272.75 0.000009 289273.00 0.000011 ... ... 289439.00 0.002076 289439.25 -0.000039 289439.50 -0.001020 289439.75 -0.001708 289440.00 -0.000621 [673 rows x 1 columns] >>> df.plot() >>> import matplotlib.pyplot as plt >>> plt.show()