4 Simulation Construction
4.1 Context
Previous sections have presented the architecture and water quality processes available within the WQ Module. This section describes the construction of a TUFLOW simulation with the WQ Module activated. This includes descriptions of all commands, with hyperlinks to the Appendices where commands and explanations are listed. TUFLOW FV is the hydrodynamic model used in all descriptions that follow.
Optional model classes (such as pathogens) and their construction are first described in the simplest simulation class for which they can be deployed. Commentary on the ordering of optional constituents is provided in subsequent sections only where needed.
4.2 Units
The WQ Module allows for simulation construction in one of two unit systems (see Section 4.5.1):
- A milligrams per litre system (which includes micrograms per litre for phytoplankton) that aligns with typical units of laboratory reporting, and
- A millimoles per cubic metre system
A single units system must be adopted for a WQ Module simulation, and unit systems cannot be mixed within a simulation. This specification has implications for at least the setting of numerical values for:
- Initial conditions
- Boundary conditions
- Computed variable parameters
When the milligrams per litre system is used, the WQ Module executes internal conversions between milligrams and millimoles, because millimoles are the units expected by the core water quality calculation routines. This conversion follows the form:
\[ n = \frac{m}{M} \tag{4.1}\]
where \(n\) is millimoles (mmol), \(m\) is mass (mg) and \(M\) is molar weight (mg/mmol). A similar concept applies to concentration and flux quantities. As such, the WQ Module assigns values to \(M\) in converting from milligrams to millimoles, i.e. from user specified milligram initial conditions, boundary conditions and computed variable parameters, to the equivalent millimole quantities. The complete list of values of \(M\) for all simulated constituents is provided in Appendix O. The two possibilities for units for each parameter are provided in Appendix A, where relevant.
As an example, if a user specifies the milligrams per litre units system (or allows the same default to be set) and sets FRP Flux == 3.1 in a materials block, then this value of 3.1 is assumed to be mg/m\(^2\)/day. Consistent with typical laboratory reporting conventions (see below), this mass flux is taken to be that of elemental phosphorus \(P\), not that of the phosphate molecule \(PO_4^{3-}\). This would mean (using Appendix O and Equation 4.1) that the equivalent millimole rate would be computed as:
\[ n = \frac{3.1}{31} = 0.1 \hspace{0.1cm} \text{mmol/m$^2$/day of P} \tag{4.2}\]
Given the above, users opting to construct WQ Module simulations in the milligrams units system need to clearly understand what is being reported in:
- Field and/or laboratory measurements, and
- Other numerical model predictions that may be used as WQ Module boundary conditions (such as catchment pollutant export models)
In the case of laboratory nutrient measurements, it is conventional to report concentrations of the typical quantities used by the WQ Module as silicate-Si, ammonium-N, nitrate-N, FRP-P, organic-C, organic-N, and organic-P. Whilst these quantities might be referred to informally as (for example) “nitrate concentrations”, the reported number is most commonly the concentration of elemental nitrogen contained within nitrate. To be clear, if a nitrate-N concentration is reported by a laboratory to be 3.5 mg/L, this means that in every litre of water, there are 3.5 milligrams of elemental nitrogen contained within nitrate molecules. Given the molar masses of elemental nitrogen and nitrate, this 3.5 milligrams of elemental N means that there are 15.5 milligrams of nitrate molecules (15.5 = 3.5 x 62/14) in the same litre of water. In this example, the concentration with which the WQ Module expects to be provided is 3.5 mg/L, not 15.5 mg/L.
The use of other model data to force WQ Module boundary conditions is also interpreted in this way. For example, a catchment model might report that an inflow to the WQ Module at an upstream riverine boundary condition has a “total nitrogen” concentration of 10.0 mg/L, and a user may have then speciated this to nitrate by applying a multiplicative factor of 0.15. If this resulting nitrate concentration of 1.5 mg/L is applied to the WQ Module as a boundary condition, it must be a concentration of elemental nitrogen within nitrate, which is consistent with what would be reported by a laboratory. This means that the user must be sure that the “total nitrogen” reported by the catchment model is in fact an elemental nitrogen concentration.
If users elect to construct WQ Module simulations in units of millimoles, then no internal WQ Module conversions take place, and the nature of the quantity (molecular or elemental) being specified is not relevant. For example, the user could specify millimoles units and FRP Flux == 0.1. This could be interpreted as a mmol/m\(^2\)/day rate of either the \(PO_4^{3-}\) molecule, or just phosphorus \(P\). This is because in one millimole of \(PO_4^{3-}\), there is also one millimole of elemental \(P\). The same one to one relationship holds for all other WQ Module relevant computed quantities (see Appendix O), other than oxygen which is treated as a diatomic molecule.
4.3 General arrangement
A water quality simulation is set up and executed under the umbrella of a TUFLOW FV control file (Figure 4.1, with other optional modules shown for illustrative purposes). That is:
- The TUFLOW FV control file (*.fvc) file remains the central file that initiates and coordinates an overall simulation. This mirrors the way in which other TUFLOW FV modules, such as the ST Module and PT Module, are activated and executed
- The TUFLOW FV control file contains a path to a separate WQ Module control file (*.fvwq) that in turn contains all the commands required to configure a WQ Module simulation
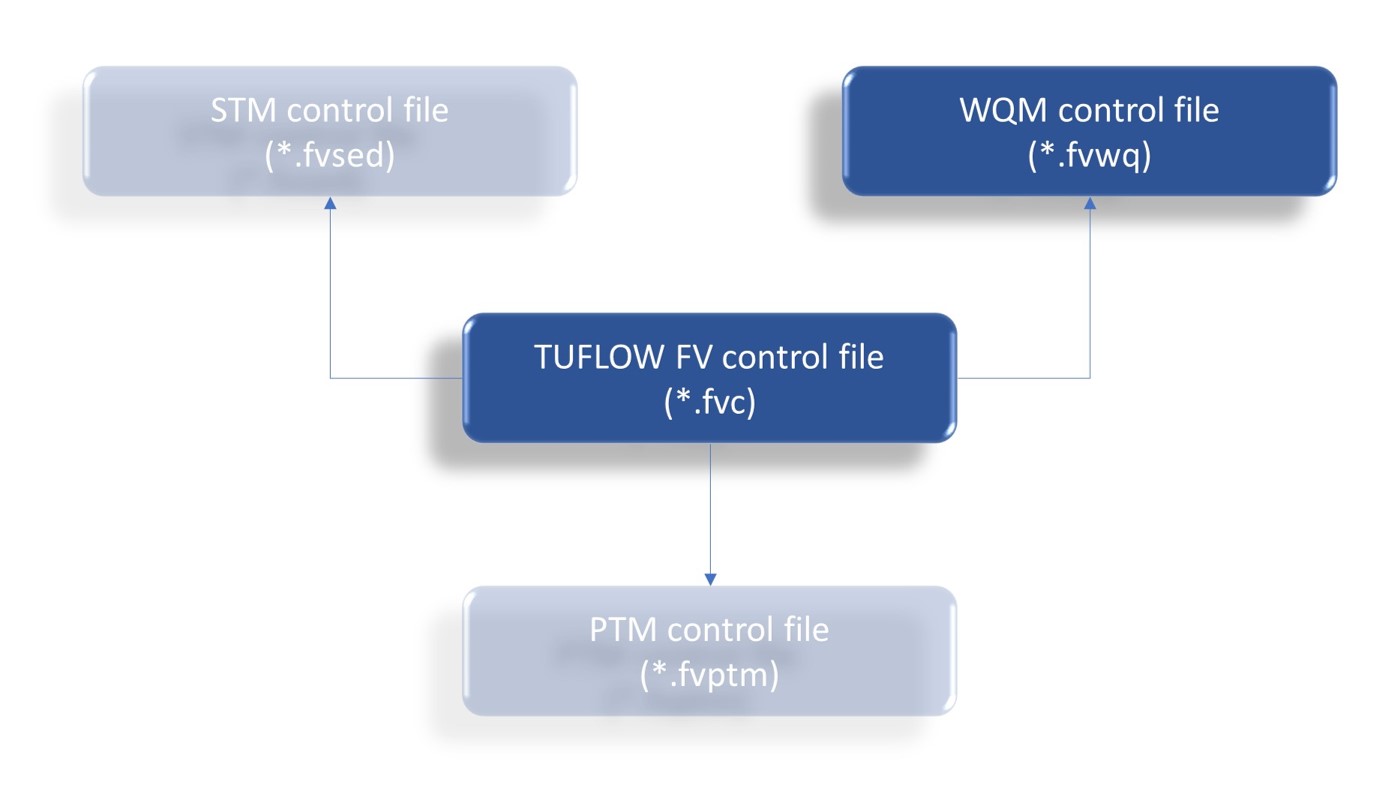
TUFLOW FV and WQ Module control file commands are presented following.
4.4 TUFLOW FV control file commands
A TUFLOW FV simulation is executed as described in the TUFLOW FV user manual. If the WQ Module is to be activated in a simulation then the following commands are to be included.
4.4.1 WQ Module activation
Activation of the WQ Module is affected by specification of the following mandatory command in the TUFLOW control file:
Water Quality Model == TUFLOW
Following this activation, TUFLOW FV will look for the specification of the name of the separate WQ Module control file via the following mandatory command:
Water Quality Control File == <_water quality control file name_>.fvwq
This *.fvwq is separate to the *.fvc and contains user specified information that describes the configuration of the water quality simulation. If the *.fvwq is located in the same directory as the *.fvc, then this filename specification needs no associated path. It is recommended however that the *.fvwq be located in a directory separate to the *.fvc so that log and other related water quality specific files can be easily curated. If this approach is adopted, the following additional *.fvc command is required, noting that the folder path is specified as relative to the folder in which the *.fvc resides:
Water Quality Model Directory == <_relative path to WQ directory_>\
This command must terminate in a \ character. If this command is issued, then the *.fvwq water quality control file must be located in the directory specified.
In certain circumstances, executing water quality calculations in shallow cells can cause numerical instabilities. To control this behaviour, the WQ Module allows for water quality calculations to be switched off in cells that have depths less than a specified minimum (advection dispersion calculations will however continue to be performed - it is only the water quality-related non-conservative transformations that are turned off). This minimum depth (in meters) is specified in the TUFLOW FV *.fvc via the command:
If this command is not issued then the default minimum depth of 0.01m (1cm) is applied.
This command parallels the TUFLOW FV command that controls the execution of hydrodynamic calculations as a function of water depth:
Cell Wet/Dry Depths == Cell Dry Depth (m), Cell Wet Depth (m)
In this TUFLOW FV command:
- The cell dry depth value (default = 1.0e-06 m) corresponds to the water depth below which a cell is dropped completely from hydrodynamic (TUFLOW FV) computations (subject to the status of surrounding cells) and is therefore considered to be ‘dry’. Cells that have dried in a given time step are given a stat value of 0 in all TUFLOW FV results files, so this stat field acts as a mask to determine which cells are wet and dry when using post processing tools and or scripts. Dry cells are not contoured in QGIS or SMS when viewed, but appear as transparent. If set to a negative value the cell dry depth is set to zero.
- The cell wet depth value (default = 1.0e-02 m) corresponds to the water depth below which a cell’s momentum is set to zero in order to avoid unphysical velocities at very low depths. The cell is not considered to be dry and therefore has a stat value of -1. If this value is less than or equal to the cell dry depth, it is set to the cell dry depth.
Given this, it is therefore recommended that across these commands and/or defaults, a user ensures that the following holds (as it does for the default values noted above):
\[ \text{cell dry depth} < \text{cell wet depth} < \text{cell water quality depth} \tag{4.3}\]
If, for example, cell water quality depth is set to a value less than cell dry depth, then water quality calculations will be attempted on cells that TUFLOW FV considers to be dry, which is to be avoided. If a situation arose where it was absolutely necessary, then cell water quality depth could be set to a value less than cell wet depth (but still greater than cell dry depth), but this is not recommended. To summarise, and if the recommended relative magnitudes of depths presented in Equation 4.3 is adopted, then the following applies:
- water depth \(>\) cell water quality depth: water quality calculations and momentum calculations performed
- cell water quality depth \(>\) water depth \(>\) cell wet depth : water quality calculations switched off, momentum calculations performed (advection and dispersion calculations also performed on water quality variables)
- cell wet depth \(>\) water depth \(>\) cell dry depth: water quality calculations switched off, momentum calculations switched off (advection and dispersion calculations also performed)
- cell dry depth \(>\) water depth: no calculations performed - cell is considered dry
To support debugging, water quality calculations can also be turned off completely for all cells and all timesteps by issuing this command in the TUFLOW FV *.fvc:
and setting \(B_{disable-wq}\) \(= 1\). Omitting this command, or setting \(B_{disable-wq}\) to zero (“0”) instead of one (“1”), will activate water quality calculations. If this command is set to one (“1”), then the WQ Module will still initialise are report as such, but when TUFLOW executes, the module will not be called.
Consistent with their specification in the *.fvc, the status of these latter two commands and their arguments are reported in the TUFLOW FV log file, rather than the WQ Module log file.
An example block of these five commands that together activate the WQ Module, point TUFLOW FV to the water quality control file ..\WQ$\Model_000.fvwq and set the minimum depth for executing water quality calculations to 5 centimetres is:
Water Quality Model == TUFLOW
Water Quality Model Directory == ..\WQ\
Water Quality Control File == ..\Model_000.fvwq
Cell Water Quality Depth == 0.05
Disable Water Quality Model == 0
4.4.2 Initial and boundary conditions
In addition to activating the WQ Module and specifying its control file, WQ Module initial and boundary condition information is also set through the TUFLOW FV control file. The processes for doing so are described below. These are followed by discussion of the related matter of constituent ordering within initial and boundary condition specifications.
4.4.2.1 Initial conditions
Water quality initial conditions are specified within or via the TUFLOW FV control file, akin to the manner in which the sediment initial conditions are set on behalf of the sediment transport module. This specification is mandatory.
There are currently a number of ways that water quality initial conditions may be specified. All are affected through TUFLOW FV commands which are described in the TUFLOW FV user manual. If no water quality initial conditions are specified, then a simulation will not execute. The specifications relevant to water quality simulations are described below. The potential limitations of some of these approaches are recognised and will be addressed in future release of the WQ Module.
4.4.2.1.1 Restart files
Restart files are binary files that are generated from previous simulations. These can be used as inputs to initialise water quality simulations, provided that the restart and simulation model geometries, and water quality simulation computed variables and units are identical. A restart file is specified for all simulated quantities (not just water quality) and is controlled through commands described in the TUFLOW FV user manual. The key command is
Restart == <_restart file name_>.rst
Most often, restart files are located in the log directory, but this is not mandatory.
4.4.2.1.2 Globally uniform
Globally uniform (i.e. across all spatial dimensions) initial conditions are set via a command issued from within the TUFLOW FV control file. This is often useful in setting initial conditions for simple small water bodies or at the commencement of a modelling process where initial conditions are set to be placeholders and updated at a later time. The command to do so is:
Initial WQ Concentration == Ordered Initial Conditions
Each water quality computed variable is set to a single value everywhere. These initial concentrations must be specified in a particular order and this order is described in the following sections for different simulation classes. If the above command is used to set water quality initial conditions, then it must be accompanied by parallel commands that set globally uniform salinity, temperature (and optionally sediment) initial conditions:
Initial Temperature == 15.0
Initial Water Level == 1.00
Initial Sediment Concentration == 10.0
Initial Salinity == 3.5
Setting a mix of globally uniform and other initial conditions (such as profile, 2D or 3D) is not permitted.
4.4.2.1.3 Globally laterally uniform
Globally laterally uniform initial conditions use an initial profile to set hydrodynamic and water quality computed variable concentrations to be everywhere the same laterally, but to vary vertically. This is often useful in setting initial conditions for deep stationary water bodies such as lakes or reservoirs. The command to do so is:
Initial Scalar Profile == <initial condition file name>.csv
An example of the form of the text file argument <initial condition file name>.csv for simulating five water quality constituents is:
Depth,Sal,temp,sed_1,WQ_1,WQ_2,WQ_3,WQ_4,WQ_5
0.0,2.0,22.0,5.0,8.0,22.0,2.6,1.4,0.5
10.0,2.5,15.0,15.0,5.0,32.0,2.6,1.4,0.2
20.0,3.0,10.0,25.0,0.0,42.0,5.6,5.4,0.1
If the above command is used, then it must include profile information that also sets laterally uniform salinity, temperature (and optionally sediment) initial conditions. Setting a mix of laterally uniform and other initial conditions (such as globally uniform, 2D or 3D) is not permitted.
The order of these columns in the argument csv file is not important, but the columns headers are keywords and must be used as shown. For example, the following structure for <initial condition file name>.csv is permitted:
Depth,temp,WQ_3,Sal,sed_1,WQ_4,WQ_1,WQ_2,WQ_5
0,22,2.6,2,5,1.4,8,22,0.5
10,15,2.6,2.5,15,1.4,5,32,0.2
20,10,3,3,25,5.4,0,42,0.1
Notwithstanding this, it is still considered best practise to develop initial and boundary condition files that have a logically sequential order. Water quality initial conditions headers are labelled “WQ_1”, “WQ_2” onward, and the match between these header labels and water quality computed variables is set by the computed variable ordering of the simulation class deployed.
4.4.2.1.4 Globally vertically uniform
Globally vertically uniform initial conditions use an initial two dimensional map to set hydrodynamic and water quality computed variable concentrations to be everywhere the same vertically, but to vary laterally. This is often useful in setting initial conditions for shallow water bodies that have horizontal concentration gradients such as small estuaries or urban lakes. The command to do so is:
Initial Condition 2D == <initial condition file name>.csv
An example of the form of the text file argument <initial condition file name>.csv for simulating five water quality constituents is:
ID,WL,sal,temp,sed_1,WQ_1
1,1.0,3.5,15,10.0,8.0
2,1.0,3.5,15,10.0,7.5
3,1.0,3.5,15,10.0,7.0
4,1.0,3.5,15,10.0,6.5
If the above command is used, then it must include information that also sets vertically uniform salinity and temperature (and optionally sediment) initial conditions, as well as water level. Setting a mix of vertically uniform and other initial conditions (such as globally uniform, laterally uniform or 3D) is not permitted.
The order of these columns in the argument csv file is not important, but the columns headers are keywords and must be used as shown. For example, the following structure for <initial condition file name>.csv is permitted:
ID,WQ_1,WL,sed_1,sal,temp
1,8.0,1.0,10.0,3.5,15
2,7.5,1.0,10.0,3.5,15
3,7.0,1.0,10.0,3.5,15
4,6.5,1.0,10.0,3.5,15
Notwithstanding this, it is still considered best practise to develop initial and boundary condition files that have a logically sequential order. Water quality initial conditions headers are labelled “WQ_1”, “WQ_2” onward, and the match between these header labels and water quality computed variables is set by the computed variable ordering of the simulation class deployed.
4.4.2.1.5 Globally varying
Globally variable initial conditions use an initial three dimensional map to set hydrodynamic and water quality computed variable concentrations at each 3D cell. This is analogous to using a restart file. The command to do so is:
Initial Condition 3D == <initial condition file name>.csv
An example of the form of the text file argument <initial condition file name>.csv for simulating five water quality constituents is as follows, noting that the “ID” column refers to a three dimensional cell ID, rather than the two dimensional column ID used in the Initial Condition 2D == command.
ID,WL,sal,temp,sed_1,WQ_1
1,1.0,3.5,15,10.0,8.0
2,1.0,3.5,14,10.0,7.5
3,1.0,3.5,13,10.0,7.0
4,1.0,3.5,12,8.0,6.5
5,1.0,3.5,15,10.0,8.0
6,1.0,3.5,14,10.0,7.4
7,1.0,3.5,13,10.0,7.1
8,1.0,3.5,11,9.0,6.6
If the above command is used, then it must include information that also sets globally varying salinity and temperature (and optionally sediment) initial conditions, as well as water level. Setting a mix of vertically uniform and other initial conditions (such as globally uniform, laterally uniform or 2D) is not permitted.
The order of these columns in the argument csv file is not important, but the columns headers are keywords and must be used as shown. For example, the following structure for <initial condition file name>.csv is permitted:
ID,WQ_1,WL,sed_1,sal,temp
1,8.0,1.0,10.0,3.5,15
2,7.5,1.0,10.0,3.5,14
3,7.0,1.0,10.0,3.5,13
4,6.5,1.0,8.0,3.5,12
5,8.0,1.0,10.0,3.5,15
6,7.4,1.0,10.0,3.5,14
7,7.1,1.0,10.0,3.5,13
8,6.6,1.0,9.0,3.5,12
Notwithstanding this, it is still considered best practise to develop initial and boundary condition files that have a logically sequential order. Water quality initial conditions headers are labelled “WQ_1”, “WQ_2” onward, and the match between these header labels and water quality computed variables is set by the computed variable ordering of the simulation class deployed.
4.4.2.2 Boundary conditions
Water quality boundary conditions are also specified via the *.fvc file, either directly or via an include statement that points TUFLOW FV to a subsidiary boundary condition control file(s). This specification of water quality variable concentrations is optional, so in early water quality model construction stages this specification can be omitted. Omitted water quality boundary conditions will be set to zero. It is not recommended that this approach be taken beyond initial simulation setup stages, but that it be used only to develop a water quality simulation to the point where it executes without issuing error or unwanted warning messages. At this point, all water quality boundary conditions should be assigned.
All TUFLOW boundary conditions that specify water temperature or salinity will also require specification of the behaviour of simulated water quality variables. Common boundary conditions to which this applies include inflows (e.g. types Q, QC, QN, QG and others) and tidal boundaries (e.g. types WLS). Wave and meteorological boundary conditions do not need specification of water quality conditions.
As for initial conditions, boundary conditions that use columnar data structures (e.g. *.csv files) are interpreted using column headers specified in an expected order within calling TUFLOW FV BC blocks. Further detail and the associated ordering is provided in the following sections (Section 4.6, Section 4.7 and Section 4.8 for simulation classes DO, inorganics and organics, respectively).
4.4.2.3 Ordering
Specification of initial conditions and most boundary conditions presently relies on listing water quality variables in a particular order. This applies in all instances when water quality initial or boundary conditions are provided in columnar or list form, which is most frequently in text file format. This is conceptually similar to the manner in which TUFLOW FV also relies on ordering of its initial and boundary conditions.
Future releases of TUFLOW FV will allow alternative methods for specification of initial and boundary conditions that do not rely on assumed ordering. In the interim however, the following applies.
4.4.2.3.1 Initial Conditions
Initial conditions, if set using means other than a restart file, must be specified with water quality constituents in a preset order (globally uniform), or be referenced using incrementally numbered headers as “WQ_1”, “WQ_2” etc (profile, 2D or 3D, see Section 4.4.2.1).
For globally uniform initial conditions (Section 4.4.2.1.2), the following *.fvc command can be used for a typical inorganics simulation class:
Initial WQ Concentration == 7.5, 0.0, 4.2, 10.5, 0.6, 5.5
There are no references to headers or variable names, but TUFLOW FV assumes that these numbers correspond to the ordered variables of the particular configuration of the inorganics simulation class returned to it from the WQ Module. In this example, this ordering is:
- Dissolved oxygen (7.5 mg/L)
- Silicate (0.0 mg/L)
- Ammonium (4.2 mg/L)
- Nitrate (10.5 mg/L)
- Filterable reactive phosphorus (0.6 mg/L), and
- One phytoplankton group (5.5 \(\mu\)g/L)
The expected ordering is the same as that for boundary condition specifications, as described below.
For other initial condition specifications that involve providing csv files, the headers “WQ_1”, “WQ_2” etc must be used to denote water quality initial conditions. The ordering of the associated columns does not matter, however the assignment of a computed variable initial condition to a “WQ_XX” header (where XX is a number) does rely on the ordering described below - the first water quality computed variable expected should be headed “WQ_1” and so on.
4.4.2.3.2 Boundary Conditions
Ordering of water quality boundary conditions is only important when specifying header information via the BC Header == (or equivalent) command within a TUFLOW FV *.fvc file BC block. It is in these commands (where comma separated header strings are specified) that TUFLOW FV expects a particular order of TUFLOW FV and WQ Module constituents. No column ordering is expected in boundary condition data files themselves. Ordering is only expected in the order of headers specified within a BC block within an TUFLOW FV control file. This is best illustrated by example.
If a user has elected to deploy the inorganics simulation class without sediment, then the following will be simulated (beyond the basic velocity and water level hydrodynamic variable suite):
- Salinity
- Temperature
- Dissolved oxygen
- Silicate
- Ammonium
- Nitrate
- Filterable reactive phosphorus
- One (assumed for this example, but can be multiple) phytoplankton group
These will eventually need proper boundary condition specification in boundary condition blocks and have supporting data provided in (usually) text files. In a simple model with only one WL boundary condition, a BC block of the following form would be required as a minimum to properly specify the hydrodynamic and water quality boundaries:
BC == WL, 1, datafile.csv
    BC Header == Time, WSEl, Sali, Temp, DOxy, SiO4, NH41, Nitr, FRPh, Bluegreen
End BC
To be clear:
- The names listed on the “BC Header ==” line (time, wse etc.) are not keywords or special names, and can be any names that a user chooses
- TUFLOW FV will however, assume that these names (whatever they have been set to) have been listed in such an order that they have a one to one correspondence to the ten computed variables as follows:
- Time \(\rightarrow\) Time stamp
- WSEl \(\rightarrow\) Water surface elevation
- Sali \(\rightarrow\) Salinity
- Temp \(\rightarrow\) Temperature
- DOxy \(\rightarrow\) Dissolved oxygen
- SiO4 \(\rightarrow\) Silicate
- NH41 \(\rightarrow\) Ammonium
- Nitr \(\rightarrow\) Nitrate
- FRPh \(\rightarrow\) Filterable reactive phosphorus
- Bluegreen \(\rightarrow\) Phytoplankton group one
- TUFLOW then matches the user specified names to the expected simulation variables, based on this ordering, to then interrogate boundary condition files.
Following the above matching, TUFLOW FV interrogates the relevant boundary condition file (“datafile.csv” in the example above), where this file can have its columns arranged in any order: the order of these columns does not matter because TUFLOW FV will use the mapping previously developed via the BC Header == command to look through all data file columns one by one, searching for the headers specified, regardless of the actual ordering of boundary condition file columns. For example, the silicate boundary condition data could be positioned in column 14 of the boundary condition file, but as long as it is labelled with the correct header (“SiO4” as specified in BC Header ==), TUFLOW FV will know to assign column 14 of the boundary condition data file to the silicate computed variable.
Ordering is set by the user’s selection of simulation class and constituent models, and is explicitly listed in each simulation class section (Section 4.6.5, Section 4.7.5 and Section 4.8.5 for DO, inorganics and organics, respectively). The expected ordering for a particular simulation is also reported in the simulation water quality log file for checking.
4.5 Water quality control file commands
The water quality control file comprises three parts, with each part containing different types of commands and flags. Whilst it is recommended that these parts be kept separate and in the order described below (especially given how complex water quality simulations can become), doing so is not mandatory and commands or command blocks may be entered in any order.
These parts are as follows, with the first two mirroring the architecture described in Chapter 2:
- Simulation controls (i.e. simulation class)
- Constituent model settings (i.e. constituent model class)
- Material specifications
Notwithstanding this, a WQ Module control file need not contain any commands, and can be completely blank. This is by design, and intended to allow users to rapidly set up and execute a TUFLOW water quality simulation. If the water quality control file is left blank, then the WQ Module will:
- Construct a simulation using the dissolved oxygen simulation class (which is the simplest class)
- Set the simulation units to mg/L
- Set library defaults for all parameters
- Set the water quality model timestep to the default
- Assign zero dissolved oxygen concentration to all boundary conditions. This is by design, and will assist in ensuring that the subsequent user-defined updating of boundary conditions is thorough and complete (zero dissolved oxygen boundary conditions are rare and therefore easily identifiable).
Initial conditions will also need to be specified in the TUFLOW FV control file as per Section 4.4.2. Specification of boundary conditions can be deferred.
The water quality control file sections are described below. Details specific to each simulation class and constituent model are provided in subsequent sections
4.5.1 Part 1: Simulation controls
Simulation controls set the high level operation of the WQ Module and are not specific to a simulation class. All are optional. Available commands set the:
- Simulation class via Simulation Class ==
- Timestep dt (in seconds) at which TUFLOW calls the WQ Module via WQ dt ==
- Units of simulation via WQ Units ==
- Frequency of equilibrium substepping Fess (in number of timesteps) to execute non-kinetic equilibrium calculations via WQ Equilibrium Substeps ==
- Reporting or suppression of minimum / maximum concentration exceedances (see Section 4.5.2) via Report Min Max Warnings ==
A typical simulation control section might therefore look like the following:
Simulation Class == DO
WQ dt == 600.0
WQ Units == MgL
WQ Equilibrium Substeps == 1
Report Min Max Warnings == ON
4.5.2 Part 2: Constituent model settings
Constituent model settings are those that:
- Specify the constituent model to be used within each preset constituent model class. These are referred to as constituent model blocks
- Set the parameters for each of these constituent models, as commands within these blocks
All are optional, however if a constituent model block is initiated then it requires an End XXXX Model command to terminate the block, where XXXX is the name of the constituent model class, such as inorganic nitrogen. An example of a user selecting to use the adsorbed filterable reactive phosphorous constituent model (that is a model available within the inorganic phosphorus constituent model class), and setting some parameters within that model is as follows:
Inorganic Phosphorus Model == FRPads
    Atmospheric Deposition == 12.6, 0.5
End Inorganic Phosphorus Model
Parameters not specified by the user are set to library defaults.
All constituent models allow for constraining (and then reporting) the predictions of their respective computed variable concentrations via the setting of minimum and maximum limits, if desired. This is often useful in identifying unusual model behaviours or instabilities. Where exceedences of these limits are identified by the WQ Module:
- Time and model cell information is written to the WQ Module log file in real time. This allows for easy identification of potential model issues via periodic examination of the WQ Module log file, rather than waiting for simulation completion
- The WQ Module resets the computed concentration to the relevant specified minimum or maximum concentration
The above resetting will result in mass conservation errors. It should not be relied on to artificially control the behaviour of an otherwise unstable or runaway water quality simulation. Rather, this functionality should be used as a convenient way to check model performance and flag potential issues, with a view to then implementing corrective action. Equally, suppressing warnings written to the WQ log file using the Report Min Max Warnings == command described in Section 4.5.1 is not recommended because doing so may mask underlying model construction issues.
These limits are optionally specified in each constituent model block. An example that sets these limits for ammonium is:
Ammonium Min Max == 0.0, 25.0
Although in the strictest sense, sediment (benthic) flux half saturation concentrations and temperature coefficients are benthic properties, the WQ Module does not yet support these parameters being applied on a spatially varying basis (i.e. per material). As such, these are considered to be constituent model global parameters and so are set in this part of the water quality control file, i.e. within respective constituent model blocks. An example that sets an oxygen half saturation and temperature coefficient for benthic flux is:
Oxygen Benthic == 5.0, 1.08
4.5.3 Part 3: Material specifications
The final part of the water quality control file (*.fvwq) provides for specification of benthic (sediment) fluxes, via material blocks. The commands required to commence and terminate a materials block are as follows:
Material == <_up to 10 comma separated material numbers, or “Default”_>
and
This material block nomenclature mirrors that used in the TUFLOW FV and sediment transport control files. An example of specifying oxygen and nitrate benthic fluxes for materials 2, 7 and 12 is:
Material == 2, 7, 12
    Oxygen Flux == -60.0
    Nitrate Flux == 12.5
End Material
The WQ Module allows for specification of a default set of benthic fluxes that are applied across all materials, by using the key word Default instead of specifying material numbers in a material block. These defaults can then be progressively overwritten on a material by material basis by specifying subsequent material blocks.
For example, a model that has ten materials in total, eight of which have the same oxygen benthic flux (all materials except 4 and 7), can have its overall oxygen benthic flux specified as:
Material == Default
    Oxygen Flux == -60.0
End Material

Material == 4, 7
    Oxygen Flux == -20.0
End Material
4.5.4 Summary
In order to set up and execute a water quality simulation using the WQ Module, the following steps are required:
- Modify the TUFLOW FV control file:
- Add at least the following commands to TUFLOW FV control file (*.fvc):
- Water Quality Model == TUFLOW
- Water Quality Control File == <water quality control file name>.fvwq
- Water Quality Model == TUFLOW
- Optionally add a folder path command to the TUFLOW FV control file (*.fvc) with a trailing backslash:
- Water Quality Model Dir == <relative path to *.fvwq file>\
- Add appropriate initial conditions for all water quality constituents, observing ordering rules where required
- Initially optionally add boundary conditions for all water quality constituents, observing ordering rules in BC Header == commands
- Add at least the following commands to TUFLOW FV control file (*.fvc):
- Create the water quality control file with the corresponding name and path
- Modify the water quality control file
- Optionally add to the water quality control file:
- Part 1: A simulation controls section
- Part 2: A constituent model setting section with one or more constituent model blocks with one or more parameter commands
- Part 3: A material block specifications section
- Optionally add to the water quality control file:
Once initially constructed, boundary conditions can be added (if not already in place), and progressive refinement and parameterisation of constituent models and benthic fluxes can be affected. Details of these commands and their options within each specific simulation class are provided in subsequent sections. Subsections are separated into the above water quality control file parts for ease and consistency of reference. All commands are optional.
4.5.5 Log files
Every WQ Module water quality simulation generates a log file that contains an echo of the WQ Module construction and execution commentary. It is written to the same location (and with the same name) as the WQ Module control file, with the file extension “fvwqlog”. This file contains a great deal of information that should be carefully reviewed. Suppressing warnings written to this log file, although possible, is not recommended or encouraged.
4.6 Simulation Class: DO
If no simulation class is specified then a simulation will be automatically constructed using this DO class, and populated with library defaults for all parameters. Computed variables will be:
- Dissolved oxygen
- Pathogens (optional, potentially multiple)
4.6.1 Prerequisites
The DO simulation class requires simulation of the following in TUFLOW FV:
- Hydrodynamics, in either two or three dimensions (including any internal one dimensional structures if present)
- Salinity
- Temperature
- Heat module on (i.e. meteorological forcing is required)
Simulation of suspended sediment (via TUFLOW FV’s sediment transport module) is optional, unless attached pathogens are simulated.
4.6.2 Part 1: Simulation specification
The DO simulation class is set via
Simulation Class == DO
The other commands in this part are not specific to this simulation class. See Section 4.5.1.
4.6.3 Part 2: Constituent model specification
As per Table 2.2 and Table 2.3, oxygen is the only mandatory constituent model class available within the DO simulation class, and there is only one oxygen constituent model within that class, with code O2. Pathogens may be optionally simulated (in any simulation class).
4.6.3.1 Model class: Oxygen
4.6.3.1.1 Constituent model: O2
This constituent model is specified as:
Oxygen Model == O2
Minimum and maximum concentrations are specified as:
Global benthic parameters (used in Equation C.6) are specified as:
The oxygen piston model to be used (in either Equation C.2 or Equation C.3) is specified as:
or
The argument (either “Wanninkhof92” or “Ho16”) activates a different oxygen piston model (Equation C.2 or Equation C.3, respectively).
Although not strictly necessary, the use of “oxygen” to prefix these block commands is deliberate so as to maintain consistency of command style with other constituent model blocks that include more than one computed variable, such as nitrogen, phosphorus and organics. Nonetheless, if the “oxygen” prefix is omitted within this constituent model block, the WQ Module will still interpret the above commands correctly.
This constituent model block must be terminated using the command:
4.6.3.2 Model class: Pathogens (optional)
This model class is optional.
4.6.3.2.1 Constituent model: Free
This constituent model is specified as:
Pathogen Model == Free, <pathname>
<pathname> is any user specified pathogen group name that:
- Uses only alphanumeric characters
- Has no spaces
- Excludes the keyword ‘PATH’, and
- Is not the same as any other group name
Minimum and maximum concentrations are specified as:
Mortality parameters are specified as:
[\(\beta\)] is not currently used but must be retained as a placeholder in this command for future use.
Light inactivation parameters are specified in three separate but related commands, with one command per light band (visible, UV-A and UV-B):
Visible Inactivation == \(k_{vis}\), \(c_{S_{vis}}^{pth}\), \(K_{DO_{vis}}^{pth}\)
UVA Inactivation == \(k_{uva}\), \(c_{S_{uva}}^{pth}\), \(K_{DO_{uva}}^{pth}\)
UVB Inactivation == \(k_{uvb}\), \(c_{S_{uvb}}^{pth}\), \(K_{DO_{uvb}}^{pth}\)
Settling of non-attached pathogens is specified as follows, with a negative number being a downwards velocity:
This constituent model block must be terminated using the command:
4.6.3.2.2 Constituent model: Attached
This constituent model must be accompanied by simulation of at least one sediment fraction within the TUFLOW FV sediment transport (ST) module, and is specified as:
Pathogen Model == Attached, <pathname>
<pathname> is any user specified pathogen group name that:
- Uses only alphanumeric characters
- Has no spaces
- Excludes the keyword ‘PATH’, and
- Is not the same as any other group name
The commands are the same as those specified within a free pathogen constituent model block (Section 4.6.3.2.1), with the following modification or additions.
Settling is specified for both free and attached pathogens:
The target attached pathogen fraction is specified as:
This constituent model block must be terminated using the command:
4.6.4 Part 3: Material specification
Oxygen benthic flux (used in Equation C.6) is specified within both default and numbered material blocks as:
4.6.5 Constituent ordering
Dissolved oxygen is the only mandatory constituent simulated by the WQ Module for this simulation class, and therefore oxygen concentration is specified as the first variable (shown in symbolic form below):
Initial WQ Concentration == \(\left[DO\right]\)
Similarly, in a BC Header == command within a BC block, oxygen is expected to be the first and only mandatory water quality variable after hydrodynamic boundary conditions.
BC Header == Time, Water_Elev, Sal, Temp, Clay, Sand, DO_mgLDO_mgL is the header used to designate oxygen in the related boundary condition file, noting that the DO_mgL column in the boundary condition file can appear in any column in the boundary condition file, and that it does not need to be the seventh column. The header text “DO_mgL” is just an example, and it can be any header desired, as long as it matches the correct column header in the boundary condition file.
4.6.5.1 Pathogens (optional)
If pathogens are simulated, then their headers are required at the end of any lists, regardless of the other hydrodynamic and water quality constituents simulated. This therefore applies to all simulation classes from DO to organics. Alive and dead pathogens are always required to be specified, in that order, and if attached pathogens are simulated then that attached pathogens header is listed between those of alive and dead. This pattern is repeated for each specified pathogen group, in the order in which pathogen groups are defined via pathogen constituent model blocks in the water quality control file. For example, where two pathogen groups are simulated (called ECOLI and CRYPTO, and defined in that order in the corresponding water quality control file), with ECOLI including attachment, the above BC header would be extended to the following:
BC Header == Time, Water_Elev, Sal, Temp, Clay, Sand, DO_mgL, ECOLI_alive, ECOLI_att, ECOLI_dead, CRYPTO_al, CRYPTO_de4.6.6 Example
Following is an example of all the available WQ Module Simulation Class == DO commands. A single material applied as zeros everywhere as the default, other than for materials 1 and 4 where the default flux is overwritten. One (optional) pathogen constituent model block has been included, but is not required.
4.7 Simulation Class: Inorganics
If the inorganics simulation class is specified with no subsequent constituent model blocks, then a simulation will be automatically constructed using this inorganics class, and populated with library defaults for all parameters. Computed variables will be:
- Dissolved oxygen
- Silicate
- Ammonium
- Nitrate
- Filterable reactive phosphorus
- One phytoplankton group named ‘dummy’ that uses the basic phytoplankton constituent model
4.7.1 Prerequisites
The inorganics simulation class requires simulation of the following in TUFLOW FV:
- Hydrodynamics, in either two or three dimensions (including any internal one dimensional structures if present)
- Salinity
- Temperature
- Heat module on (i.e. meteorological forcing is required)
Simulation of suspended sediment (via TUFLOW FV’s sediment transport module) is required only if adsorbed phosphorus is to be simulated by the WQ Module. This is affected through specification of the adsorbed phosphorus constituent model within the phosphorus constituent model class.
4.7.2 Part 1: Simulation specification
The inorganics simulation class is set via
Simulation Class == Inorganics
The other commands in this part are not specific to this simulation class. See Section 4.5.1.
4.7.3 Part 2: Constituent model specification
As per Table 2.2 and Table 2.3, there are several constituent model classes available within the inorganics simulation class. The commands for each are described following.
4.7.3.1 Model class: Oxygen
4.7.3.1.1 Constituent model: O2
The commands for this constituent model are described in Section 4.6.3.1.1.
4.7.3.2 Model class: Silicate
4.7.3.2.1 Constituent model: Si
This constituent model is specified as:
Silicate Model == Si
Minimum and maximum concentrations are specified as:
Global benthic flux parameters (used in Equation D.1) are specified as:
Although not strictly necessary, the use of “silicate” to prefix the above block commands is deliberate so as to maintain consistency of command style with other constituent model blocks that include more than one computed variable, such as nitrogen, phosphorus and organics.
Silicate sediment flux calculations are set to be dependent on dissolved oxygen concentrations by default. Although not recommended, the following will switch off this dependence by setting the term labelled “Influence of oxygen” in Equation D.1 to a value of 1.0.
Oxygen == OFF
This constituent model block must be terminated using the command:
4.7.3.3 Model class: Inorganic nitrogen
4.7.3.3.1 Constituent model: AmmoniumNitrate
This constituent model is specified as:
Inorganic Nitrogen Model == AmmoniumNitrate
Minimum and maximum concentrations for both ammonium and nitrate are specified as:
Ammonium Min Max == \(\left[NH_4\right]_{min}^{NH_4}\), \(\left[NH_4\right]_{max}^{NH_4}\)
Nitrate Min Max == \(\left[NO_3\right]_{min}^{NO_3}\), \(\left[NO_3\right]_{max}^{NO_3}\)
Global benthic flux parameters (used in Equation E.1) for ammonium and nitrate are specified as:
Ammonium Benthic == \(K_{sed-O_2}^{NH_4}\), \(\theta_{sed}^{NH_4}\)
Nitrate Benthic == \(K_{sed-O_2}^{NO_3}\), \(\theta_{sed}^{NO_3}\)
Nitrification parameters (used in Equation E.3 and therefore Equation E.4) are set in a single command as:
Denitrification parameters (used in Equation E.5 or Equation E.6) are also set in a single command as:
Denitrification == Michaelis Menten, \(R_{denit}^{NO_3}\), \(K_{denit-O_2-MM}^{NO_3}\), \(\theta_{denit}^{NO_3}\)
or
Denitrification == Exponential, \(R_{denit}^{NO_3}\), \(K_{denit-O_2-exp}^{NO_3}\), \(\theta_{denit}^{NO_3}\)
The first argument (either “Michaelis Menten” or “Exponential”) activates a different denitrification model (Equation E.5 or Equation E.6, respectively).
Anaerobic oxidation of ammonium parameters (used in Equation E.10) are also set in a single command as:
Anaerobic Oxidation Of Ammonium == \(R_{anmx}^{NH_4,NO_3}\), \(K_{anmx-NH_4}^{NH_4,NO_3}\), \(K_{anmx-NO_3}^{NH_4,NO_3}\)
Dissimilatory reduction of nitrate to ammonium parameters (used in Equation E.11) are set in a single command as:
Ammonium and nitrate sediment flux, nitrification, denitrification, anammox and DRNA calculations are all set to be dependent on dissolved oxygen concentrations by default. Although not recommended, the following will switch off this dependence for all these processes.
Oxygen == OFF
This command overrides any previously specified values of \(K_{sed-O_2}^{NH_4}\), \(K_{sed-O_2}^{NO_3}\), \(K_{nitrif-O_2}^{NH_4}\), \(K_{denit-O_2-MM}^{NO_3}\) and \(K_{denit-O_2-exp}^{NO_3}\). It should be specified after all other related commands if the influence of oxygen on nitrogen processes is to be switched off. Setting this command to ‘OFF’ will completely disable anammox and DRNA calculations.
Atmospheric deposition parameters (used in Equation E.13, Equation E.14, Equation E.17 and Equation E.18) are set via the command:
The same split of TN into ammonium and nitrate is applied to both \(\left[TN\right]_{rain}\) and \(R_{atm-dry}^{TN}\).
This constituent model block must be terminated using the command:
4.7.3.4 Model class: Inorganic phosphorus
4.7.3.4.1 Constituent model: FRPhs
This constituent model is specified as:
Inorganic Phosphorus Model == FRPhs
Minimum and maximum concentrations for FRP are specified as:
Global benthic flux parameters (used in Equation F.1) are specified as:
FRP sediment flux calculations are set to be dependent on dissolved oxygen concentrations by default. Although not recommended, the following will switch off this dependence by setting the term labelled “Influence of oxygen” in Equation F.1 to a value of 1.0.
Oxygen == OFF
Wet atmospheric deposition parameters (used in Equation F.2) are set via the command:
An additional parameter for dry atmospheric deposition is required in the FRPhsAds constituent model (see Section 4.7.3.4.2).
This constituent model block must be terminated using the command:
4.7.3.4.2 Constituent model: FRPhsads
This constituent model is specified as:
Inorganic Phosphorus Model == FRPhsAds
The TUFLOW FV Sediment Transport (ST) Module must be used to simulate at least one sediment fraction in order to use this WQ Module constituent model.
In addition to the commands described in Section 4.7.3.4.1, the following commands are available in this constituent model.
Minimum and maximum concentrations for adsorbed FRP are specified as:
Two FRP adsorption models are available, as per Equation F.6 and Equation F.7. These require specification of one (linear) or two (quadratic) parameters, respectively after specification of the model to be used:
Adsorption == Linear, \(K_{ads-L}^{FRP}\)
or
Adsorption == Quadratic, \(K_{ads-Q}^{FRP}\), \(Q_{max}^{FRP}\)
The settling velocity of adsorbed phosphorus is set as follows. Future releases of the WQ Module will dynamically link this settling velocity to the calculations of the TUFLOW FV ST Module.
Dry atmospheric deposition of FRP is activated in this simulation model (used in Equation F.3) and is specified via the same command as wet deposition, but with one additional argument. This additional argument is ignored if the FRPhsAds constituent model has not been set:
This constituent model block must be terminated using the command:
4.7.3.5 Model class: Phytoplankton
Given the large number of potential commands and options for phytoplankton simulation, horizontal rules have been used to separate subsections below for clarity.
4.7.3.5.1 Constituent model: Basic
This constituent model is specified as:
Phyto Model == Basic, groupname
‘groupname’ is any user specified phytoplankton group name that:
- Uses only alphanumeric characters
- Has no spaces
- Excludes the keywords ‘COM’ and ‘PHYTO’, or any combination of letters already included in a standard computed variable name, such as “INT_N_”, “INT_P” or “_rho”, and
- Is not the same as any other group name
Minimum and maximum concentrations for a phytoplankton group are specified as follows. No prefix keyword (as was the case for constituents such as “ammonium”) is required:
4.7.3.5.1.1 Temperature limitation
Temperature limitation can be specified by one of the following models:
None (no temperature limitation applied)
Temperature Limitation == None
or
Standard (used in Equation I.1 through to Equation I.8)
4.7.3.5.1.2 Salinity limitation
Salinity limitation can be specified by one of the following models. All functions can be applied to either (not both) primary productivity or respiration, except for the estuarine limitation model which can only be applied to primary productivity. Specifically:
- Specifying respective function limitation values (i.e. \(L_{max-fresh}^{phy}\) or \(L_{zero-marine}^{phy}\) or \(L_{zero-mix}^{phy}\)) to be between zero and one will set a function to apply to primary productivity rates as a reducer
- Specifying respective function limitation values (i.e. \(L_{max-fresh}^{phy}\) or \(L_{zero-marine}^{phy}\) or \(L_{zero-mix}^{phy}\)) to be greater than one will set a function to apply to respiration rates as an enhancer
The available models are as follows:
None (no salinity limitation applied)
Salinity Limitation == None
or
Fresh (used in Equation I.27)
Salinity Limitation == Fresh, \(S_{opt-fresh}^{phy}\), \(S_{max-fresh}^{phy}\), \(L_{max-fresh}^{phy}\)
or
Marine (used in Equation I.30)
or
Mixed (used in Equation I.33)
or
Estuarine (used in Equation I.36)
4.7.3.5.1.3 Light limitation
Light limitation can be specified by one of the following models:
Basic (used in Equation I.19)
Light Limitation == Basic, \(Ke^{phy}\), \(I_{K-bas}\)
or
Monod (used in Equation I.20)
Light Limitation == Monod, \(Ke^{phy}\), \(I_{K-mon}\)
or
Steele (used in Equation I.21)
Light Limitation == Steele, \(Ke^{phy}\), \(I_{S-ste}\)
or
Webb (used in Equation I.22)
Light Limitation == Webb, \(Ke^{phy}\), \(I_{K-web}\)
or
Jassby (used in Equation I.23)
Light Limitation == Jassby, \(Ke^{phy}\), \(I_{K-jas}\)
or
Chalker (used in Equation I.24)
Light Limitation == Chalker, \(Ke^{phy}\), \(I_{K-cha}\)
or
Klepper (used in Equation I.25)
Light Limitation == Klepper, \(Ke^{phy}\), \(I_{S-kle}\)
or
Integrated (used in Equation I.26)
Light Limitation == Integrated, \(Ke^{phy}\), \(I_{S-int}\)
4.7.3.5.1.4 Nitrogen limitation
Nitrogen limitation parameters (used in Equation I.9, Section I.3.1) are set via the command:
These, together with additional parameters, are the same as those used in specifying the nitrogen limitation behaviour of the advanced phytoplankton model (Section 4.7.3.5.2.1).
4.7.3.5.1.5 Phosphorus limitation
Phosphorus limitation parameters (used in Equation I.13, Section I.4.1) are set via the command:
These, together with additional parameters, are the same as those used in specifying the phosphorus limitation behaviour of the advanced phytoplankton model (Section 4.7.3.5.2.2).
4.7.3.5.1.6 Silicate limitation
Silicate limitation parameters (used in Equation I.17, Section I.5) are set via the command:
Specification of this limitation triggers the uptake of silicate to be on in the phytoplankton group’s block in which the command appears. Omit this command to set silicate uptake to off for a given phytoplankton group.
4.7.3.5.1.7 Uptake
Nutrient uptake parameters for nitrogen, phosphorus and silicate (if relevant) (used in Equation J.2, Equation J.7 and Equation J.9 respectively) are set via the command:
If specified, the value of \(X_{Si-C-con}^{phy}\) is ignored if silicate uptake has not been triggered via specification of silicate limitation parameters via Silicate Limitation ==.
4.7.3.5.1.8 Primary productivity
Primary productivity (growth) parameters (used in Equation H.2) are set via the command:
4.7.3.5.1.9 Respiration
Respiration parameters are set via the following command. The first two parameters are used directly to compute the respiration rate \(R_{resp\langle computed\rangle}^{phy}\) via Equation H.6. The third and fourth parameters are used to compute excretive and mortality fluxes in Equation K.1 and Equation K.2, respectively. Both these equations use the respiration rate computed from the first two parameters \(R_{resp}^{phy}\) and \(\theta_{resp}^{phy}\). Although not strictly related to respiration, the final parameter does represent a reduction of biomass and is used to compute exudation loss using Equation H.12.
4.7.3.5.1.10 Carbon to Chlorophyll a ratio
The carbon to chlorophyll a ratio (used in converting between simulation units, and reporting total chlorophyll a as a diagnostic variable if the mmol units system is used) is specified via the command:
4.7.3.5.1.11 Nitrogen fixing
Nitrogen fixing parameters are specified as follows. The first parameter is used in Equation J.2 to compute the nitrogen fixation flux, and the second parameter modifies computed primary productivity via Equation H.3.
Setting this command triggers nitrogen fixing to be on, otherwise it is off by default.
4.7.3.5.1.12 Settling
Settling can be specified by one of the following models:
None
Settling == None
or
Constant
Settling == Constant, \(V_{settle}^{phy}\)
or
Constant with density correction (as per Equation H.18)
Settling == Thermal, \(V_{settle}^{phy}\)
or
Stokes (used in Equation H.19), where density is required to be simulated as a computed variable, and thus requires the specification of \(I_K\).
Settling == Stokes, \(I_{K-sto}\)
If \(I_K\) is specified in any light limitation model applied to a phytoplankton group with stokes settling, then a value of \(I_{K-sto}\) specified in the stokes model will be ignored. Cell density limits are applied as the defaults and are not user specifiable.
4.7.3.5.1.13 Termination
This constituent model block must be terminated using the command:
4.7.3.5.2 Constituent model: Advanced
This constituent model is specified as:
Phyto Model ==Advanced, groupname
‘groupname’ is any user specified phytoplankton group name that:
- Uses only alphanumeric characters
- Has no spaces
- Excludes the keywords ‘COM’ and ‘PHYTO’, or any combination of letters already included in a standard computed variable name, such as “INT_N_”, “INT_P” or “_rho”, and
- Is not the same as any other group name
The following commands are the same as those described for the basic phytoplankton model in Section 4.7.3.5.1 (links are to relevant sections above rather than to the command Appendix, for ease of cross reference):
The following commands differ for the advanced phytoplankton model compared to the basic model.
4.7.3.5.2.1 Nitrogen limitation
Nitrogen limitation parameters (used in Equation I.11, Section I.3.2) are set via the command:
Nitrogen Limitation == \(\left[N\right]_{min}^{phy}\), \(K_{N}^{phy}\), \(X_{N-C-min}^{phy}\), \(X_{N-C-max}^{phy}\)
The first two parameters are the same as those that would be specified using the same command in the basic phytoplankton model (Section 4.7.3.5.1.4).
4.7.3.5.2.2 Phosphorus limitation
Phosphorus limitation parameters (used in Equation I.15, Section I.4.2) are set via the command:
Phosphorus Limitation == \(\left[P\right]_{min}^{phy}\), \(K_{P}^{phy}\), \(X_{P-C-min}^{phy}\), \(X_{P-C-max}^{phy}\)
The first two parameters are the same as those that would be specified using the same command in the basic phytoplankton model (Section 4.7.3.5.1.5).
4.7.3.5.2.3 Uptake
Nutrient uptake parameters for nitrogen, phosphorus and silicate (if relevant) (used in Equation J.4, Equation J.8 and Equation J.9 respectively) are set via the command:
The value of \(X_{Si-C-con}^{phy}\) is ignored if silicate uptake has not been triggered through specification of a silicate limitation function.
4.7.3.5.2.4 Settling
An additional settling model can be specified in the advanced phytoplankton constituent model as:
Motile (Section H.4.5), where internal nutrient simulation is required to simulate motility
Settling == Motile, \(V_{mot}^{phy}\), \(I_{K-mot}\)
If \(I_K\) is specified in any light limitation model applied to an advanced constituent model phytoplankton group with motile settling, then a value of \(I_{K-mot}\) specified in the motile model will be ignored. Cell density limits are applied as the defaults and are not user specifiable.
This constituent model block must be terminated using the command:
4.7.3.6 Model class: Pathogens (optional)
This model class is optional.
4.7.3.6.1 Constituent model: Free
The commands for this constituent model are described in Section 4.6.3.2.1.
4.7.3.6.2 Constituent model: Attached
The commands for this constituent model are described in Section 4.6.3.2.2.
4.7.4 Part 3: Material specification
Oxygen, silicate, ammonium, nitrate and FRP benthic fluxes are specified within both default and numbered material blocks as:
Oxygen Flux == \(F_{sed}^{O_2}\)
Silicate Flux == \(F_{sed}^{sil}\)
Ammonium Flux == \(F_{sed}^{NH_4}\)
Nitrate Flux == \(F_{sed}^{NO_3}\)
FRP Flux == \(F_{sed}^{FRP}\)
No adsorbed FRP or phytoplankton sediment fluxes are required.
4.7.5 Constituent ordering
Different constituent model selections result in different ordering requirements for specifying computed variable initial conditions (either globally with an implied order, or setting the ordered map from water quality computed variables to “WQ_1”, “WQ_2” etc) and BC Header == commands. For clarity, these are initially presented below using only phytoplankton placeholders in lists. This is possible because phytoplankton specifications are always appended at the end of initial condition or “BC Header ==” lists. Phytoplankton specifications are then presented as additive to these lists in subsequent sections. This is not meant to imply that phytoplankton simulation is optional in the inorganics simulation class - it is mandatory and has only been described separately here only for clarity of presentation.
4.7.5.1 Excluding phytoplankton
The only constituent model choice that influences ordering (other than phytoplankton) is the phosphorus model. These two possibilities are described below.
4.7.5.1.1 Phosphorus model FRPhs
If adsorbed FRP is not simulated (i.e. Phosphorus Model == FRPhs), then in all columnar and list style initial conditions, computed variables are expected in the following order (and map to “WQ_1” etc accordingly):
Initial WQ Concentration == \(\left[ DO \right]\), \(\left[ Si \right]\), \(\left[ NH_4 \right]\), \(\left[ NO_3 \right]\), \(\left[ FRP \right]\), \(\ldots\) {phytoplankton placeholder/s}
Similarly, in a BC Header == command within a BC block, the following order of computed variables is expected after hydrodynamic (HD BCs) boundary conditions:
BC Header == {HD BCs} ... DO_mgL, Si_mgL, Amm_mgL, Nit_mgL, FRP_mgL, ... {phytoplankton placeholder/s}With regard to the above BC Header == command:
- DO_mgL, Si_mgL, Amm_mgL, Nit_mgL and FRP_mgL are the headers used to designate oxygen, silicate, ammonium, nitrate and FRP in the related boundary condition file, respectively
- Whilst this ordering in the command is fixed, the corresponding columnar data can appear in any order in the associated boundary condition file
- The header texts “DO_mgL”, “Si_mgL”, “Amm_mgL”, “Nit_mgL” and “FRP_mgL” are not special keywords. They can be any headers desired, as long as they match the correct respective boundary condition file column headers
4.7.5.1.2 Phosphorus model FRPhsads
If adsorbed FRP is simulated (i.e. Phosphorus Model == FRPhsAds), then in all columnar and list style initial conditions, computed variables are expected in the following order (and map to “WQ_1” etc accordingly):
Initial WQ Concentration == \(\left[ DO \right]\), \(\left[ Si \right]\), \(\left[ NH_4 \right]\), \(\left[ NO_3 \right]\), \(\left[ FRP \right]\), \(\left[ FRPads \right]\), \(\ldots\) {phytoplankton placeholder/s}
Similarly, in a BC Header == command within a BC block, the following order of computed variables is expected after hydrodynamic boundary conditions:
BC Header == {HD BCs} ... DO_mgL, Si_mgL, Amm_mgL, Nit_mgL, FRP_mgL, FRP_ads_mgL, ... phytoplankton placeholder/sWith regard to the above BC Header == command:
- DO_mgL, Si_mgL, Amm_mgL, Nit_mgL, FRP_mgL and FRP_ads_mgL are the headers used to designate oxygen, silicate, ammonium, nitrate, FRP and adsorbed FRP in the related boundary condition file, respectively
- Whilst this ordering in the command is fixed, the corresponding columnar data can appear in any order in the associated boundary condition file
- The header texts “DO_mgL”, “Si_mgL”, “Amm_mgL”, “Nit_mgL”, “FRP_mgL” and “FRP_ads_mgL”are not special keywords. They can be any headers desired, as long as they match the correct respective boundary condition file column headers
4.7.5.2 Including phytoplankton
Phytoplankton initial conditions and “BC Header ==” fields are appended directly to the above computed variable specifications, as denoted by the {phytoplankton placeholder/s} flag above.
Each phytoplankton group is specified using a cluster of values (initial conditions) or headers (BC block) and these clusters must appear in the same order as phytoplankton groups are specified in the water quality control file. The content of each phytoplankton cluster is determined both by the phytoplankton constituent model used and the settling model selected. These are described below, using a placeholder for preceding (non-phytoplankton) computed variables for clarity. These are described above and can be interpreted as either of the orderings specified in Section 4.7.5.1.1 or Section 4.7.5.1.2.
Two phytoplankton groups are used in all examples.
4.7.5.2.1 Basic phytoplankton model
If the basic phytoplankton constituent model is used, then in all columnar and list style initial conditions, computed variables are expected in the following order (and map to “WQ_XX” after the final computed variable number accordingly):
Initial WQ Concentration == {non-phytoplankton placeholders} \(\ldots\) \(\underbrace{[PHY_1]}_{\text{Cluster 1}}\), \(\underbrace{[PHY_2]}_{\text{Cluster 2}}\)
In order to match water quality control file groups with initial conditions, it is assumed that the groups’ clusters of initial conditions are specified above in the same order that Phyto Model == blocks are presented in the water quality control file.
Similarly, in a BC Header == command within a BC block, the following order of computed variables is expected after hydrodynamic and non-phytoplankton boundary conditions:
BC Header == {HD BCs} \(\ldots\) {non-phytoplankton placeholders} \(\ldots\) \(\underbrace{\text{phyto\_green}}_{\text{Cluster 1}}\), \(\underbrace{\text{phyto\_bluegreen}}_{\text{Cluster 2}}\)
With regard to the above BC Header == command:
- phyto_green and phyto_bluegreen are the headers used to designate the boundary concentrations of the two phytoplankton groups listed in the water quality control file
- In order to match water quality control file groups with these boundary condition clusters, it is assumed that the groups’ boundary condition header clusters are specified above in the same order that Phyto Model == blocks appear in the water quality control file
- Although the names listed in the BC Header == command above do not need to match the names listed in the water quality control file phytoplankton blocks, it is recommended that they do have names that are correlated with the phytoplankton group names in the water quality control file, for model integrity
- Whilst this ordering in the command is fixed, the corresponding columnar data can appear in any order in the associated boundary condition file
- The header texts “phyto_green” and “phyto_bluegreen” are not special keywords. They can be any headers desired, as long as they match the correct respective boundary condition file column headers
If the command Settling == Stokes is used for a phytoplankton group, then phytoplankton cell density must be simulated as a computed variable that requires initial and boundary conditions. This therefore affects the clustering of phytoplankton initial and boundary conditions. For example, if the first (and not the second) phytoplankton group above used the stokes settling model, then the following initial condition command would be required:
Initial WQ Concentration == {HD} \(\ldots\) {non-phytoplankton placeholders} \(\ldots\) \(\underbrace{[PHY_1],\rho_{phy1}}_{\text{Cluster 1}}\), \(\underbrace{[PHY_2]}_{\text{Cluster 2}}\)
\(\rho_{phy1}\) is the initial density of the first phytoplankton group’s cells. A density initial condition is not required for the second phytoplankton species because it does not use stokes settling.
Similarly, in a BC Header == command within a BC block, the following order of computed variables is expected after hydrodynamic and non-phytoplankton boundary conditions:
BC Header == {HD BCs} \(\ldots\) {non-phytoplankton placeholders} \(\ldots\) \(\underbrace{\text{phyto\_green, phyto\_green\_density}}_{\text{Cluster 1}}\), \(\underbrace{\text{phyto\_bluegreen}}_{\text{Cluster 2}}\)
If both phytoplankton groups simulated density then the corresponding initial condition and boundary condition commands would be as follows:
Initial WQ Concentration== {HD} \(\ldots\) {non-phytoplankton placeholders} \(\ldots\) \(\underbrace{[PHY_1],\rho_{phy1}}_{\text{Cluster 1}}\), \(\underbrace{[PHY_2],\rho_{phy2} }_{\text{Cluster 2}}\)
BC Header == {HD BCs} \(\ldots\) {non-phytoplankton placeholders} \(\ldots\) \(\underbrace{\text{phyto\_green, phyto\_green\_density}}_{\text{Cluster 1}}\), \(\underbrace{\text{phyto\_bluegreen, phyto\_bluegreen\_density}}_{\text{Cluster 2}}\)
\(\rho_{phy1}\) and \(\rho_{phy1}\) are the initial densities of the first and second phytoplankton group’s cells.
The same notes provided above apply to these commands.
4.7.5.2.2 Advanced phytoplankton model
If the advanced phytoplankton constituent model is used, then in all columnar and list style initial conditions, computed variables are expected in the following order (and map to “WQ_XX” after the final computed variable number accordingly):
Initial WQ Concentration == {non-phytoplankton placeholders} \(\ldots\) \(\underbrace{[PHY_1],[IN_1],[IP_1]}_{\text{Cluster 1}}\), \(\underbrace{[PHY_2],[IN_2],[IP_2]}_{\text{Cluster 2}}\)
In order to match water quality control file groups with initial conditions, it is assumed that the groups’ initial conditions are specified above in the same order that Phyto Model == blocks are presented in the water quality control file.
Similarly, in a BC Header == command within a BC block, the following order of computed variables is expected after hydrodynamic and non-phytoplankton boundary conditions:
BC Header == {HD BCs} \(\ldots\) {non-phytoplankton placeholders} \(\ldots\) \(\underbrace{\text{phyto\_gr, gr\_intN, gr\_intP}}_{\text{Cluster 1}}\), \(\underbrace{\text{phyto\_blgr, blgr\_intN, blgr\_intP}}_{\text{Cluster 2}}\)
With regard to the above BC Header == command:
- phyto_gr and phyto_blgr are the headers used to designate the boundary concentrations of the two phytoplankton groups listed in the water quality control file
- gr_intN and gr_intP are the headers used to designate the boundary concentrations of internal nitrogen and internal phosphorus for the green phytoplankton group, respectively
- blgr_intN and blgr_intP are the headers used to designate the boundary concentrations of internal nitrogen and internal phosphorus for the bluegreen group, respectively
- In order to match water quality control file groups with these boundary conditions, it is assumed that the groups’ boundary condition header clusters are specified above in the same order that Phyto Model == blocks appear in the water quality control file
- Although the names listed in the BC Header == command above do not need to match the names listed in the water quality control file phytoplankton blocks, it is recommended that they do have names that are correlated with the phytoplankton group names in the water quality control file, for model integrity
- Whilst this ordering in the command is fixed, the corresponding columnar data can appear in any order in the associated boundary condition file
- The header texts “phyto_gr” and “phyto_blgr” are not special keywords. They can be any headers desired, as long as they match the correct respective boundary condition file column headers
If the command Settling == Stokes is used for a phytoplankton group, then phytoplankton cell density must be simulated as a computed variable that requires initial and boundary conditions. This therefore affects the clustering of phytoplankton initial and boundary conditions. If the first phytoplankton group above used the advanced phytoplankton model with the stokes settling model, and the second group used the basic phytoplankton model without stokes settling, then the following commands would be required:
Initial WQ Concentration == {non-phytoplankton placeholders} \(\ldots\) \(\underbrace{[PHY_1],\rho_{phy_1},[IN_1],[IP_1]}_{\text{Cluster 1}}\), \(\underbrace{[PHY_2]}_{\text{Cluster 2}}\)
Similarly, in a BC Header == command within a BC block, the following order of computed variables is expected after hydrodynamic and non-phytoplankton boundary conditions:
BC Header == {HD BCs} \(\ldots\) {non-phytoplankton placeholders} \(\ldots\) \(\underbrace{\text{phyto\_gr, gr\_dens, gr\_intN, gr\_intP}}_{\text{Cluster 1}}\), \(\underbrace{\text{phyto\_blgr}}_{\text{Cluster 2}}\)
If both phytoplankton groups simulated density, again with the first and second groups using the advanced and basic models respectively, then the corresponding commands would be as follows:
Initial WQ Concentration == {non-phytoplankton placeholders} \(\ldots\) \(\underbrace{[PHY_1],\rho_{phy_1},[IN_1],[IP_1]}_{\text{Cluster 1}}\), \(\underbrace{[PHY_2],\rho_{phy_2}}_{\text{Cluster 2}}\)
BC Header == {HD BCs} \(\ldots\) {non-phytoplankton placeholders} \(\ldots\) \(\underbrace{\text{phyto\_gr, gr\_dens, gr\_intN, gr\_intP}}_{\text{Cluster 1}}\), \(\underbrace{\text{phyto\_blgr, blgr\_dens}}_{\text{Cluster 2}}\)
The same notes provided above apply to these commands.
4.7.5.3 Including pathogens (optional)
The ordering requirements for pathogens are the same as those described in Section 4.6.5.1. Pathogen headers are always included last (i.e. after phytoplankton in the inorganics simulation class).
4.7.6 Example
Following is an example of all the available WQ Module Simulation Class == Inorganics commands, with a single material applied as zeros everywhere as the default, and then modified by a further specification for materials 3 and 7. Two phytoplankton groups (one each of the basic and advanced models) are set. Pathogens have been omitted for clarity, but could be added as per Section 4.6.6.
4.8 Simulation Class: Organics
If the organics simulation class is specified with no subsequent constituent model blocks, then a simulation will be automatically constructed using this organics class, and populated with library defaults for all parameters. Computed variables will be:
- Dissolved oxygen
- Silicate
- Ammonium
- Nitrate
- Filterable reactive phosphorus
- Dissolved organic carbon
- Particulate organic carbon
- Dissolved organic nitrogen
- Particulate organic nitrogen
- Dissolved organic phosphorus
- Particulate organic phosphorus
- One phytoplankton group named ‘dummy’ that uses the basic phytoplankton constituent model
For clarity, this section uses acronyms for some computed variable names, and these acronyms are expanded in Appendix O. All references below to “organic matter” are to labile organic computed variables, unless specifically termed as refractory.
4.8.1 Prerequisites
The organics simulation class requires simulation of the following in TUFLOW FV:
- Hydrodynamics, in either two or three dimensions (including any internal one dimensional structures if present)
- Salinity
- Temperature
- Heat module on (i.e. meteorological forcing is required)
Simulation of suspended sediment (via TUFLOW FV’s sediment transport module) is required only if adsorbed phosphorus is to be simulated by the WQ Module.
4.8.2 Part 1: Simulation specification
The organics simulation class is set via
Simulation Class == Organics
The other commands in this part are not specific to this simulation class. See Section 4.5.1.
4.8.3 Part 2: Constituent model specification
As per Table 2.2 and Table 2.3, there are several constituent model classes available within the organics simulation class. The commands for each are described following. To avoid repetition, cross references to explanations are provided for commands that are included in previous simulation classes and remain the same for this class.
4.8.3.1 Model class: Oxygen
4.8.3.1.1 Constituent model: O2
The commands for this constituent model are described in Section 4.7.3.1.1.
4.8.3.2 Model class: Silicate
4.8.3.2.1 Constituent model: Si
The commands for this constituent model are described in Section 4.7.3.2.1.
4.8.3.3 Model class: Inorganic nitrogen
4.8.3.3.1 Constituent model: AmmoniumNitrate
The commands for this constituent model are described in Section 4.7.3.3.1.
4.8.3.4 Model class: Inorganic phosphorus
4.8.3.4.1 Constituent model: FRPhs
The commands for this constituent model are described in Section 4.7.3.4.1.
4.8.3.4.2 Constituent model: FRPhsAds
The commands for this constituent model are described in Section 4.7.3.4.2.
4.8.3.5 Model class: Organic matter
4.8.3.5.1 Constituent model: Labile
This constituent model is specified as:
Organic Matter Model == Labile
Minimum and maximum concentrations are specified as:
Carbon Min Max == \(\left[POC\right]_{min}^{POC}\), \(\left[POC\right]_{max}^{POC}\), \(\left[DOC\right]_{min}^{DOC}\), \(\left[DOC\right]_{max}^{DOC}\)
Nitrogen Min Max == \(\left[PON\right]_{min}^{PON}\), \(\left[PON\right]_{max}^{PON}\), \(\left[DON\right]_{min}^{DON}\), \(\left[DON\right]_{max}^{DON}\)
Phosphorus Min Max == \(\left[POP\right]_{min}^{POP}\), \(\left[POP\right]_{max}^{POP}\), \(\left[DOP\right]_{min}^{DOP}\), \(\left[DOP\right]_{max}^{DOP}\)
Global benthic flux parameters (used in Equation M.1) are specified as:
Although not strictly necessary, the use of “organics” to prefix the above block command is deliberate so as to maintain consistency of command style with other constituent model blocks that include more than one computed variable, such as nitrogen and phosphorus. The command will also be accepted simply as Benthic ==.
Particulate organic hydrolysis parameters (used in Equation M.2 and therefore Equation M.3) are set in a single command as:
Hydrolysis == \(R_{hyd}^{POC}\), \(R_{hyd}^{PON}\), \(R_{hyd}^{POP}\), \(K_{hyd-O_2}^{POM}\), \(\theta_{hyd}^{POM}\)
Dissolved organic mineralisation parameters (used in Equation M.8 and therefore Equation M.9) are set in a single command, together with the corresponding denitrification parameters describing associated consumption of nitrate due to mineralisation (used in Equation M.10 and Equation M.14) as:
Mineralisation == \(R_{miner}^{DOM}\), \(K_{miner-O_2}^{DOM}\), \(\theta_{miner}^{DOM}\), \(f_{an}\), \(K_{miner-NO_3}^{NO_3}\)
If \(K_{miner-NO_3}^{NO_3}\) is set to 0.0, then the consumption of nitrate due to mineralisation of organic matter is switched off.
Settling of labile particulate organic matter can be specified by one of the following models:
None
Settling == None
or
Constant
Settling == Constant, \(V_{settle}^{lorg}\)
or
Constant with density correction (as per Equation M.28)
Settling == Thermal, \(V_{settle}^{lorg}\)
or
Stokes (used in Equation M.29)
Settling == Stokes, \(d_{lorg}\), \(\rho_{lorg}\)
Self shading due to the presence of labile organics (used in Equation M.26) parameters are set as:
This constituent model block must be terminated using the command:
4.8.3.5.2 Constituent model: Refractory
This constituent model encompasses all the functionality (and commands) of the labile organic matter constituent model, but offers further commands to simulate refractory organic processes, and their interaction with labile organic and inorganic computed variables.
This constituent model is specified as:
Organic Matter Model == Refractory
Minimum and maximum concentrations are specified as follows. The carbon command includes the specification of refractory particulate organic matter minimums and maximums, as well as dissolved refractories.
Ref Carbon Min Max == \(\left[RPOM\right]_{min}^{RPOM}\), \(\left[RPOM\right]_{max}^{RPOM}\), \(\left[RDOC\right]_{min}^{RDOC}\), \(\left[RDOC\right]_{max}^{RDOC}\)
Ref Nitrogen Min Max == \(\left[RDON\right]_{min}^{RDON}\), \(\left[RDON\right]_{max}^{RDON}\)
Ref Phosphorus Min Max == \(\left[RDOP\right]_{min}^{RDOP}\), \(\left[RDOP\right]_{max}^{RDOP}\)
The breakdown of refractory particulate organic matter into labile particulate organic matter (used in Equation M.5 and Equation M.6) parameters are set as:
The activation of refractory dissolved organic matter to labile dissolved organic matter (used in Equation M.17 and Equation M.18) parameter is set as:
The photolysis of refractory organics (used in Equation M.27) is not turned on unless the following command is issued. It sets the parameter that proportions the split of photolysed refractory dissolved organics to labile dissolved organics and inorganics:
Settling of refractory particulate organic matter can be specified by one of the following models:
None
Ref Settling == None
or
Constant
Ref Settling == Constant, \(V_{settle}^{rorg}\)
or
Constant with density correction (as per Equation M.28)
Ref Settling == Thermal, \(V_{settle}^{rorg}\)
or
Stokes (used in Equation M.29)
Ref Settling == Stokes, \(d_{rorg}\), \(\rho_{rorg}\)
The settling model selected for the refractory particulate organic matter model must be the same as that of the labile particulate organic matter. The input parameters to this model may be different.
Self shading due to the presence of refractory organics (used in Equation M.27) parameters are set as:
This constituent model block must be terminated using the command:
4.8.3.6 Model class: Phytoplankton
4.8.3.6.1 Constituent model: Basic
The commands for this constituent model are described in Section 4.7.3.5.1.
4.8.3.6.2 Constituent model: Advanced
The commands for this constituent model are described in Section 4.7.3.5.2.
4.8.3.7 Model class: Pathogens (optional)
This model class is optional.
4.8.3.7.1 Constituent model: Free
The commands for this constituent model are described in Section 4.6.3.2.1.
4.8.3.7.2 Constituent model: Attached
The commands for this constituent model are described in Section 4.6.3.2.2.
4.8.4 Part 3: Material specification
Oxygen, silicate, ammonium, nitrate FRP, dissolved organic carbon, dissolved organic nitrogen and dissolved organic phosphorus benthic fluxes are specified within both default and numbered material blocks as:
Oxygen Flux == \(F_{sed}^{O_2}\)
Silicate Flux == \(F_{sed}^{sil}\)
Ammonium Flux == \(F_{sed}^{NH_4}\)
Nitrate Flux == \(F_{sed}^{NO_3}\)
FRP Flux == \(F_{sed}^{FRP}\)
DOC Flux == \(F_{sed}^{DOC}\)
DON Flux == \(F_{sed}^{DON}\)
DOP Flux == \(F_{sed}^{DOP}\)
No adsorbed FRP, phytoplankton or particulate organic fluxes are required.
4.8.5 Constituent ordering
As for the inorganics simulation class (see Section 4.7.5) different organic matter constituent model selections require different orderings in specifying computed variable initial conditions and BC Header == commands. Notwithstanding this, all the ordering information presented in Section 4.7.5 for the inorganics simulation class applies equally to the organics simulation class, other than for insertions related to the simulation of organics (described below). As such, that section should be reviewed with regard to ordering of the following:
- Dissolved oxygen
- Silicate
- Inorganic nitrogen
- Inorganic phosphorus (including the optional simulation of adsorbed FRP), and
- Phytoplankton groups (including the basic and advanced phytoplankton constituent models, with and without simulation of cell density)
The additional initial condition and BC Header == fields related to the organics simulation class do not change the order of computed variable fields presented in Section 4.7.5 other than to insert organic matter constituent model computed variables immediately after FRP computed variables and immediately prior to required phytoplankton fields. This insertion and ordering is presented following for the labile and refractory organic matter constituent models.
4.8.5.1 Labile
The computed variables required to be specified within the labile organic matter constituent model are, in order:
- Dissolved organic carbon
- Particulate organic carbon
- Dissolved organic nitrogen
- Particulate organic nitrogen
- Dissolved organic phosphorus
- Particulate organic phosphorus
All columnar and list style initial condition computed variables are therefore expected in the following order (and map to “WQ_1” etc accordingly)
Initial WQ Concentration == \(\left[ DO \right]\), \(\left[ Si \right]\), \(\left[ NH_4 \right]\), \(\left[ NO_3 \right]\), \(\left[ FRP \right]\), (optionally \(\left[ FRPads \right]\)), \(\left[ DOC \right]\), \(\left[ POC \right]\), \(\left[ DON \right]\), \(\left[ PON \right]\), \(\left[ DOP \right]\), \(\left[ POP \right]\), \(\ldots\) {phytoplankton placeholder/s}
Similarly, in a BC Header == command within a BC block, the following order of computed variables is expected after hydrodynamic (HD BCs) boundary conditions (and map to “WQ_1” etc accordingly):
BC Header == {HD BCs} ... DO_mgL, Si_mgL, Amm_mgL, Nit_mgL, FRP_mgL, (optionally FRPads_mgL), DOC_mgL, POC_mgL, DON_mgL, PON_mgL, DOP_mgL, POP_mgL, ... {phytoplankton placeholder/s} With regard to the above BC Header == command:
- DO_mgL, Si_mgL, Amm_mgL, Nit_mgL, FRP_mgL (optionally FRPads_mgL), DOC_mgL, POC_mgL, DON_mgL, PON_mgL, DOP_mgL and POP_mgL are the headers used to designate oxygen, silicate, ammonium, nitrate, FRP (optionally adsorbed FRP), dissolved organic carbon, particulate organic carbon, dissolved organic nitrogen, particulate organic nitrogen, dissolved organic phosphorus and particulate organic phosphorus in the related boundary condition file, respectively
- Whilst this ordering in the command is fixed, the corresponding columnar data can appear in any order in the associated boundary condition file
- The header texts “DO_mgL”, “Si_mgL”, “Amm_mgL”, “Nit_mgL”, “FRP_mgL” (optionally “FRPads_mgL”), “DOC_mgL”, “POC_mgL”, “DON_mgL”, “PON_mgL”, “DOP_mgL” and “POP_mgL” are not special keywords. They can be any headers desired, as long as they match the correct respective boundary condition file column headers
4.8.5.2 Refractory
The computed variables required to be specified within the labile organic matter constituent model are, in order:
- Dissolved organic carbon
- Particulate organic carbon
- Dissolved organic nitrogen
- Particulate organic nitrogen
- Dissolved organic phosphorus
- Particulate organic phosphorus
- Refractory dissolved organic carbon
- Refractory dissolved organic nitrogen
- Refractory dissolved organic phosphorus
- Refractory particulate organic matter
All columnar and list style initial condition computed variables are therefore expected in the following order (and map to “WQ_1” etc accordingly)
Initial WQ Concentration == \(\left[ DO \right]\), \(\left[ Si \right]\), \(\left[ NH_4 \right]\), \(\left[ NO_3 \right]\), \(\left[ FRP \right]\), (optionally \(\left[ FRPads \right]\)), \(\left[ DOC \right]\), \(\left[ POC \right]\), \(\left[ DON \right]\), \(\left[ PON \right]\), \(\left[ DOP \right]\), \(\left[ POP \right]\), \(\left[ RDOC \right]\), \(\left[ RDON \right]\), \(\left[ RDOP \right]\), \(\left[ RPOM \right]\), \(\ldots\) {phytoplankton placeholder/s}
Similarly, in a BC Header == command within a BC block, the following order of computed variables is expected after hydrodynamic (HD BCs) boundary conditions (and map to “WQ_1” etc accordingly):
BC Header == {HD BCs} ... DO_mgL, Si_mgL, Amm_mgL, Nit_mgL, FRP_mgL, (optionally FRPads_mgL), DOC_mgL, POC_mgL, DON_mgL, PON_mgL, DOP_mgL, POP_mgL, RDOC_mgL, RDON_mgL, RDOP_mgL, RPOM_mgL,= ... {phytoplankton placeholder/s}With regard to the above BC Header == command:
- DO_mgL, Si_mgL, Amm_mgL, Nit_mgL, FRP_mgL (optionally FRPads_mgL), DOC_mgL, POC_mgL, DON_mgL, PON_mgL, DOP_mgL, POP_mgL, RDOC_mgL, RDON_mgL, RDOP_mgL and RPOM_mgL are the headers used to designate oxygen, silicate, ammonium, nitrate, FRP (optionally adsorbed FRP), dissolved organic carbon, particulate organic carbon, dissolved organic nitrogen, particulate organic nitrogen, dissolved organic phosphorus, particulate organic phosphorus, refractory dissolved organic carbon, refractory dissolved nitrogen, refractory dissolved phosphorus and refractory particulate organic matter in the related boundary condition file, respectively
- Whilst this ordering in the command is fixed, the corresponding columnar data can appear in any order in the associated boundary condition file
- The header texts “DO_mgL”, “Si_mgL”, “Amm_mgL”, “Nit_mgL”, “FRP_mgL” (optionally “FRPads_mgL”), “DOC_mgL”, “POC_mgL”, “DON_mgL”, “PON_mgL”, “DOP_mgL”, “POP_mgL”, “RDOC_mgL”, “RDON_mgL”, “RDOP_mgL” and “RPOM_mgL” are not special keywords. They can be any headers desired, as long as they match the correct respective boundary condition file column headers.
4.8.5.3 Including pathogens (optional)
The ordering requirements for pathogens are the same as those described in Section 4.6.5.1. Pathogen headers are always included last (i.e. after phytoplankton in the organics simulation class).
4.8.6 Example
Following is an example of all the available WQ Module Simulation Class == Organics commands, with a single material applied as zeros everywhere as the default, and then modified by a further specification for materials 3 and 7. Two phytoplankton groups (one each of the basic and advanced models) are set, and the refractory organic matter constituent model deployed. Pathogens have been omitted for clarity, but could be added as per Section 4.6.6.
4.9 Outputs
WQ Module outputs are set via commands specified in the TUFLOW FV control file, as described below. Available outputs include:
- WQ Module outputs:
- Computed variables, i.e. time varying concentrations of simulated quantities (e.g. dissolved oxygen). See Appendix O
- Diagnostic variables, i.e. time varying quantities that describe rates, and similar such processes which modify computed variables (e.g. sediment flux of nitrate). See Appendix P
- TUFLOW FV integrated outputs of WQ Module variables:
- Fluxes across predefined nodestrings, e.g. the time varying flux of a WQ Module computed variable integrated by TUFLOW FV across a two dimensional vertical curtain, and
- Instantaneous masses, e.g. the time varying integrated mass of a WQ Module computed variable, computed across the entire model domain
- Mass balance fluxes, .e.g. the cumulative flux of mass through:
- Every water quality flux pathway (such as oxygen production due to a phytoplankton group’s primary productivity), and
- Every QC, QC_POLY, Q, WL, WLS and QN boundary
Computed and diagnostic variables are output directly by the WQ Module, whilst integrated outputs are computed by TUFLOW FV, using WQ Module computed and diagnostic variables as inputs.
All these types of outputs use the same structures as described in the TUFLOW FV user manual for hydrodynamic and other TUFLOW FV outputs, namely via specification of Output == blocks. The relevant sections of the TUFLOW FV manual should be reviewed to supplement the material presented here. WQ Module and TUFLOW FV outputs are described below.
4.9.1 WQ Module outputs
All WQ Module output computed and diagnostic variables, together with their output names, are included in Appendices Appendix O and Appendix P. The listed output names can be copied and pasted directly from the Appendices to a control file, with the exception of phytoplankton variables, where the user specified group name is included within the variable name, so will need to be inserted by the user.
The most common Output == blocks used by the WQ Module to report the time variation of computed and/or diagnostic variables are:
- 0D points: Output == Points (these are depth averaged timeseries outputs at an X/Y location)
- 1D profiles: Output == Profiles
- 2D maps: Output == DatV
- 3D fields: Output == NetCDF
The simplest manner in which to specify the computed and diagnostic variables to be included in these blocks is to use the WQ_All and WQ_Diag_All flags against the Output Parameters == command. An example of a 3D NetCDF output block that reports computed variables (WQ_All) and diagnostic variables (WQ_Diag_All) every hour is:
Output == NetCDF
    Output Parameters == WQ_All, WQ_Diag_All
    Output Interval == 3600.00
End Output
WQ Module outputs need not be in distinct output blocks of their own, but can be added to existing TUFLOW output blocks, for example:
Output == DatV
    Output Parameters == h, V, WQ_All, WQ_Diag_All
    Output Interval == 3600.00
    Vertical Averaging == Depth-All
End Output
Water quality outputs are often voluminous. In order to avoid potentially cumbersome data handling issues around large output files, the Output Parameters == command arguments can be tailored to list only those computed or diagnostic variables required for analysis, rather than using the blanket WQ_All and WQ_Diag_All arguments. An example of such an output command block that only reports dissolved oxygen concentration and atmospheric oxygen exchange is:
Output == NetCDF
    Output Parameters == h, WQ_DISS_OXYGEN_MG_L, WQ_DIAG_O2_ATMOS_EXCHANGE_MG_M2_D
    Output Interval == 3600.00
End Output
4.9.2 TUFLOW FV outputs
The most common Output == blocks used to report the time variation of integrated quantities computed by TUFLOW FV are:
- Mass: Output == Mass
- Flux: Output == Flux
- Mass balance: Output == Massbalance
Variable names are not specified, with all available variables being included by default. Examples of such output blocks are:
Output == Mass
    Output Interval == 900.00
End Output

Output == Flux
    Output Interval == 900.00
End Output

Output == Massbalance
    Output Interval == 900.00
End Output
The first two output types produce one .csv file each, with headers that append ‘_MASS’ and ‘_FLUX’ to the variable names presented in the Appendices. The third Massbalance output is explained in detail in the TUFLOW FV documentation here. In summary, this output produces:
- Mass fluxes in a single .csv file per water quality constituent, where each file contains timeseries of cumulative mass fluxes through every boundary and internal flux pathway relevant to that constituent
- Total cumulative mass fluxes (i.e. the sum of the above at each timestep)
- Multiple estimates of instantaneous mass (as timeseries) and associated percentage errors to allow for analysis of mass conservation performance
- Timeseries of the estimated number of mass turnovers of each water quality constituent (see link to TUFLOW FV documentation above for more detail), which assists in assessing the dynamism (i.e. rapidity of processing), of a constituent within the simulated domain
Across these automated outputs, users can interrogate the rate and manner in which each simulated quantity’s mass is transformed through every relevant internal process (e.g. denitrification) and across every model boundary (e.g. tidal boundaries) within the simulated domain. These are referred to as ‘mass fluxes’, and this examination allows users to come to an understanding of the domain’s overall environmental operation. This is separate and distinct to examining concentration timeseries at points (which is the traditional approach), which typically offers limited insight into system operation and can mask understanding if relied upon solely to assess model robustness. These flux outputs offered by TUFLOW FV are therefore valuable tools that assist in providing understanding as to why a model is predicting the water quality concentrations that it is, and so allow users to move beyond relying on concentration-based statistical assessments of model-to-measured data as a metric for model fitness for purpose. This understanding in turn shifts the potential pathway taken for model calibration and validation away from one that might include a degree of educated assumptions (and therefore large numbers of time consuming model reruns) and towards one that is evidence based with targeted and informed model parameter changes (and correspondingly less model reruns). As such, it is recommended strongly that these outputs be switched on as standard, and actively used across the entire water quality modelling calibration and scenario execution process.
Each simulated water quality constituent has its own .csv mass balance file written as an output, with relevant fluxes and masses. These can be opened directly in any spreadsheet package, plotted and/or reconfigured as a user wishes.
The following apply to the mass balance outputs produced by TUFLOW FV, as related to water quality simulation:
- Mechanics of outputs:
- If adsorbed FRP is simulated, then its fluxes are reported together with FRP in the ‘…MASSBALANCE_WQ_FRP_MG_L.csv’ file. This provides a complete description of FRP related mass fluxes in a single file. As such, the ‘…MASSBALANCE_WQ_FRP_ADS_MG_L.csv’ file is created but not populated
- Pathogen CFU fluxes are not reported. This is because typical CFU counts are very large numbers (1e+20 CFU is common) and the required mass balance calculations therefore suffer from not insignificant numerical truncation errors. This in turn leads to mass balances that relatively quickly become unstable. As such, the relevant ‘…MASSBALANCE_WQ_PATH_….csv’ files are created but not populated
- Mass balance of internal nutrients (i.e. use of the advanced phytoplankton model) is not supported
- Mass balance of the MMM units system is not supported
- Mass balance of nitrogen fixation is not supported
- Interpretation of outputs:
- Mass should be conserved (generally) to within a few percent over an annual simulation period, for a given constituent. This depends significantly on the rates of change of all fluxes however, and where fluxes vary rapidly in time, mass balance errors should be expected to accumulate. One example of where this might be particularly relevant is across tidal boundaries where large tides in deep water occur - mass fluxes of water quality constituents will likely vary rapidly in these settings and cause potential mass balance reporting errors
- Outputting mass balance csv files at a finer timestep may go part way to overcoming such error accumulation. However, if the output timestep is reduced too far, then some water quality processes will have fluxes so small that they are numerically truncated and written as zeros (when they are in fact non zero). This will cause additional mass balance errors, and these will compound in time
- In order to provide value to a model set up and calibration process, focus should be given to concurrent examination of timeseries (for a given constituent) of:
- Total mass (computed from all methods),
- Cumulative mass fluxes, and
- Turnovers
- This provides the simplest and cleanest overview of all mass fluxes and their relationship to total mass for a single computed variable - which in turn facilitates system understanding and provides direction to the selection of water quality parameters to alter in achieving calibration. This comparison should first be undertaken with volume, to elucidate water movement and turnover properties, and then on a constituent by constituent basis thereafter. An example for volume, dissolved oxygen and ammonium is presented below. It shows that:
- Volume (Figure 4.2):
- Water movement is dominated by catchment inflows (source) and tidal outflows (sink)
- The system turns over water approximately 160 times in the period shown (orange line and secondary vertical axis)
- Dissolved oxygen (Figure 4.3):
- Dissolved oxygen’s largest source is atmospheric aeration, and largest sinks are tidal outflow, sediment consumption and mineralisation of organics. Parameters that control these processes will therefore provide the greatest impact on model concentration predictions
- The system turns over dissolved oxygen approximately 180 times in the period shown (orange line and secondary vertical axis) - this is 15% more rapid than the water turnover behaviour
- Ammonium (Figure 4.4):
- Ammonium’s largest source in DRNA and largest sinks are tidal outflow and nitrification. Parameters that control these processes will therefore provide the greatest impact on model concentration predictions
- The system turns over ammonium approximately 1000 times in the period shown (orange line and secondary vertical axis) - this is six times more rapid than the water turnover behaviour, and suggests that the system is highly dynamic with respect to ammonium and that perturbations may have non trivial impacts on system balance and resilience. This rapid rate of turnover is not evident from examining the total mass (or average concentration) alone, which is relatively steady over the simulation period. This points to the utility of examining mass fluxes at all times during a water quality modelling process, and not relying solely on concentration point-to-point comparisons
- Volume (Figure 4.2):
Each mass balance output .csv file consists of columnar timeseries data, with column headers presented and described in the following tables:
- DO Simulation Class: Table 4.1
- Inorganics Simulation Class: Table 4.2
- Organics Simulation Class: Table 4.3
Acronyms within column headers include:
- V = Volumetric quantity
- A = Areal quantity
- MF = Mass flux
- FV = TUFLOW FV output or computed from same
- NS = Nodestring, encompassing WL, WLS and QN boundary types
- WQ = Water Quality output or computed from same
- Q = Q boundary type
- QC = QC or QC_POLY boundary types
- PCT = Percent
- pn = phytoplankton name
| Simulation Class | DO | |
|---|---|---|
Dissolved Oxygen |
<fvc_name>_MASSBALANCE_WQ_DISS_OXYGEN_MG_L.csv |
Units |
TIME |
ISODATE Time |
|
FV_WQ_MASS |
Instantaneous dissolved oxygen mass computed from TUFLOW FV state variables. Always a positive quantity. |
tonnes O\(_2\) |
WQ_MF_QC |
Accumulated dissolved oxygen mass fluxes across all QC and QC_POLY boundaries, summed to a single timeseries. Can be a positive or negative quantity. |
tonnes O\(_2\) |
WQ_MF_Q |
Accumulated dissolved oxygen mass fluxes across all Q boundaries, summed to a single timeseries. Can be a positive or negative quantity. |
tonnes O\(_2\) |
WQ_MF_NS |
Accumulated dissolved oxygen mass fluxes across all WL, WLS and QN boundaries, summed to a single timeseries. Can be a positive or negative quantity. |
tonnes O\(_2\) |
WQ_MF_A_SEDFLX |
Accumulated dissolved oxygen mass flux due to sediment consumption or production across the entire domain, summed to a single timeseries. Can be a positive or negative quantity. |
tonnes O\(_2\) |
WQ_MF_A_ATMFLX |
Accumulated dissolved oxygen mass flux due to atmospheric exchange across the entire domain, summed to a single timeseries. Can be a positive or negative quantity. |
tonnes O\(_2\) |
WQ_MF_TOTAL |
Total of accumulated dissolved oxygen mass fluxes, with individual signs preserved. Can be a positive or negative quantity. |
tonnes O\(_2\) |
MF_WQ_MASS |
Estimate of total dissolved oxygen mass computed from summing previous timestep dissolved oxygen mass (MF_WQ_MASS) and current timestep (not cumulative) dissolved oxygen mass fluxes. See Section Q.4 for details. Always a positive quantity. |
tonnes O\(_2\) |
MF_PCT_ERROR |
The percentage difference between FV_WQ_MASS and MF_WQ_MASS. Can be a positive or negative quantity. |
|
MF_TURNOVERS |
See explanatory text above and link to TUFLOW FV documentation (see Section 4.9.2). Always a positive quantity. |
No units |
| Simulation Class | Inorganics | |
|---|---|---|
Dissolved Oxygen |
<fvc_name>_MASSBALANCE_WQ_DISS_OXYGEN_MG_L.csv |
Units |
TIME |
ISODATE Time |
|
FV_WQ_MASS |
Instantaneous dissolved oxygen mass computed from TUFLOW FV state variables. Always a positive quantity. |
tonnes O\(_2\) |
WQ_MF_QC |
Accumulated dissolved oxygen mass fluxes across all QC and QC_POLY boundaries, summed to a single timeseries. Can be a positive or negative quantity. |
tonnes O\(_2\) |
WQ_MF_Q |
Accumulated dissolved oxygen mass fluxes across all Q boundaries, summed to a single timeseries. Can be a positive or negative quantity. |
tonnes O\(_2\) |
WQ_MF_NS |
Accumulated dissolved oxygen mass fluxes across all WL, WLS and QN boundaries, summed to a single timeseries. Can be a positive or negative quantity. |
tonnes O\(_2\) |
WQ_MF_A_SEDFLX |
Accumulated dissolved oxygen mass flux due to sediment consumption or production across the entire domain, summed to a single timeseries. Can be a positive or negative quantity. |
tonnes O\(_2\) |
WQ_MF_A_ATMFLX |
Accumulated dissolved oxygen mass flux due to atmospheric exchange across the entire domain, summed to a single timeseries. Can be a positive or negative quantity. |
tonnes O\(_2\) |
WQ_MF_V_NITRIF |
Accumulated dissolved oxygen mass flux due to consumption through nitrification across the entire domain, summed to a single timeseries. Always a negative quantity. |
tonnes O\(_2\) |
WQ_MF_V_PRMPRD_<PN> |
Accumulated dissolved oxygen mass flux due to production through phytoplankton primary productivity across the entire domain, summed to a single timeseries. The accumulated mass flux is reported separately for each phytoplankton group, so this field will be repeated (with a different <PN> inserted in each column header) for as many columns as there are phytoplankton groups. Always a positive quantity. |
tonnes O\(_2\) |
WQ_MF_V_RESPIR_<PN> |
Accumulated dissolved oxygen mass flux due to consumption through phytoplankton respiration across the entire domain, summed to a single timeseries. The accumulated mass flux is reported separately for each phytoplankton group, so this field will be repeated (with a different <PN> inserted in each column header) for as many columns as there are phytoplankton groups. Always a negative quantity. |
tonnes O\(_2\) |
WQ_MF_TOTAL |
Total of accumulated dissolved oxygen mass fluxes, with individual signs preserved. Can be a positive or negative quantity. |
tonnes O\(_2\) |
MF_WQ_MASS |
Estimate of total dissolved oxygen mass computed from summing previous timestep dissolved oxygen mass (MF_WQ_MASS) and current timestep (not cumulative) dissolved oxygen mass fluxes. See Section Q.4 for details. Always a positive quantity. |
tonnes O\(_2\) |
MF_PCT_ERROR |
The percentage difference between FV_WQ_MASS and MF_WQ_MASS. Can be a positive or negative quantity. |
|
MF_TURNOVERS |
See explanatory text above and link to TUFLOW FV documentation (see Section 4.9.2). Always a positive quantity. |
No units |
Silicate |
<fvc_name>_MASSBALANCE_WQ_SILICATE_MG_L.csv |
Units |
TIME |
ISODATE Time |
|
FV_WQ_MASS |
Instantaneous silicate mass computed from TUFLOW FV state variables. Always a positive quantity. |
tonnes Si |
WQ_MF_QC |
Accumulated silicate mass fluxes across all QC and QC_POLY boundaries, summed to a single timeseries. Can be a positive or negative quantity. |
tonnes Si |
WQ_MF_Q |
Accumulated silicate mass fluxes across all Q boundaries, summed to a single timeseries. Can be a positive or negative quantity. |
tonnes Si |
WQ_MF_NS |
Accumulated silicate mass fluxes across all WL, WLS and QN boundaries, summed to a single timeseries. Can be a positive or negative quantity. |
tonnes Si |
WQ_MF_A_SEDFLX |
Accumulated silicate mass flux due to sediment consumption or production across the entire domain, summed to a single timeseries. Can be a positive or negative quantity. |
tonnes Si |
WQ_MF_V_PRMPRD_<PN> |
Accumulated silicate mass flux due to consumption through phytoplankton primary productivity across the entire domain, summed to a single timeseries. The accumulated mass flux is reported separately for each phytoplankton group that uptakes silicate, so this field will be repeated (with a different <PN> inserted in each column header) for as many columns as there are silicate based phytoplankton groups. No column is included for phytoplankton groups that do not include silicate uptake. Always a negative quantity. |
tonnes Si |
WQ_MF_V_MORTAL_<PN> |
Accumulated silicate mass flux due to production through phytoplankton mortality across the entire domain, summed to a single timeseries. The accumulated mass flux is reported separately for each phytoplankton group that uptakes silicate, so this field will be repeated (with a different <PN> inserted in each column header) for as many columns as there are silicate based phytoplankton groups. No column is included for phytoplankton groups that do not include silicate uptake. Always a positive quantity. |
tonnes Si |
WQ_MF_V_EXCRET_<PN> |
Accumulated silicate mass flux due to production through phytoplankton excretion across the entire domain, summed to a single timeseries. The accumulated mass flux is reported separately for each phytoplankton group that uptakes silicate, so this field will be repeated (with a different <PN> inserted in each column header) for as many columns as there are silicate based phytoplankton groups. No column is included for phytoplankton groups that do not include silicate uptake. Always a positive quantity. |
tonnes Si |
WQ_MF_TOTAL |
Total of accumulated silicate mass fluxes, with individual signs preserved. Can be a positive or negative quantity. |
tonnes Si |
MF_WQ_MASS |
Estimate of total silicate mass computed from summing previous timestep silicate mass (MF_WQ_MASS) and current timestep (not cumulative) silicate mass fluxes. See Section Q.4 for details. Always a positive quantity. |
tonnes Si |
MF_PCT_ERROR |
The percentage difference between FV_WQ_MASS and MF_WQ_MASS. Can be a positive or negative quantity. |
|
MF_TURNOVERS |
See explanatory text above and link to TUFLOW FV documentation (see Section 4.9.2). Always a positive quantity. |
No units |
Ammonium |
<fvc_name>_MASSBALANCE_WQ_AMMONIUM_MG_L.csv |
Units |
TIME |
ISODATE Time |
|
FV_WQ_MASS |
Instantaneous ammonium mass computed from TUFLOW FV state variables. Always a positive quantity. |
tonnes N |
WQ_MF_QC |
Accumulated ammonium mass fluxes across all QC and QC_POLY boundaries, summed to a single timeseries. Can be a positive or negative quantity. |
tonnes N |
WQ_MF_Q |
Accumulated ammonium mass fluxes across all Q boundaries, summed to a single timeseries. Can be a positive or negative quantity. |
tonnes N |
WQ_MF_NS |
Accumulated ammonium mass fluxes across all WL, WLS and QN boundaries, summed to a single timeseries. Can be a positive or negative quantity. |
tonnes N |
WQ_MF_A_SEDFLX |
Accumulated ammonium mass flux due to sediment consumption or production across the entire domain, summed to a single timeseries. Can be a positive or negative quantity. |
tonnes N |
WQ_MF_A_ATMFLX |
Accumulated ammonium mass flux due to atmospheric exchange across the entire domain, summed to a single timeseries. Always a positive quantity. |
tonnes N |
WQ_MF_V_DRNA |
Accumulated ammonium mass flux due to dissimilatory reduction of nitrate to ammonium across the entire domain, summed to a single timeseries. Always a positive quantity. |
tonnes N |
WQ_MF_V_ANMMOX |
Accumulated ammonium mass flux due to anaerobic oxidation of ammonium to nitrate across the entire domain, summed to a single timeseries. Always a negative quantity. |
tonnes N |
WQ_MF_V_NITRIF |
Accumulated ammonium mass flux due to nitrification across the entire domain, summed to a single timeseries. Always a negative quantity. |
tonnes N |
WQ_MF_V_PRMPRD_<PN> |
Accumulated ammonium mass flux due to consumption through phytoplankton primary productivity across the entire domain, summed to a single timeseries. The accumulated mass flux is reported separately for each phytoplankton group, so this field will be repeated (with a different <PN> inserted in each column header) for as many columns as there are phytoplankton groups. Always a negative quantity. |
tonnes N |
WQ_MF_V_MORTAL_<PN> |
Accumulated ammonium mass flux due to production through phytoplankton mortality across the entire domain, summed to a single timeseries. The accumulated mass flux is reported separately for each phytoplankton group, so this field will be repeated (with a different <PN> inserted in each column header) for as many columns as there are phytoplankton groups. Always a positive quantity. |
tonnes N |
WQ_MF_V_EXCRET_<PN> |
Accumulated ammonium mass flux due to production through phytoplankton excretion across the entire domain, summed to a single timeseries. The accumulated mass flux is reported separately for each phytoplankton group, so this field will be repeated (with a different <PN> inserted in each column header) for as many columns as there are phytoplankton groups. Always a positive quantity. |
tonnes N |
WQ_MF_TOTAL |
Total of accumulated ammonium mass fluxes, with individual signs preserved. Can be a positive or negative quantity. |
tonnes N |
MF_WQ_MASS |
Estimate of total ammonium mass computed from summing previous timestep ammonium mass (MF_WQ_MASS) and current timestep (not cumulative) ammonium mass fluxes. See Section Q.4 for details. Always a positive quantity. |
tonnes N |
MF_PCT_ERROR |
The percentage difference between FV_WQ_MASS and MF_WQ_MASS. Can be a positive or negative quantity. |
|
MF_TURNOVERS |
See explanatory text above and link to TUFLOW FV documentation (see Section 4.9.2). Always a positive quantity. |
No units |
Nitrate |
<fvc_name>_MASSBALANCE_WQ_NITRATE_MG_L.csv |
Units |
TIME |
ISODATE Time |
|
FV_WQ_MASS |
Instantaneous nitrate mass computed from TUFLOW FV state variables. Always a positive quantity. |
tonnes N |
WQ_MF_QC |
Accumulated nitrate mass fluxes across all QC and QC_POLY boundaries, summed to a single timeseries. Can be a positive or negative quantity. |
tonnes N |
WQ_MF_Q |
Accumulated nitrate mass fluxes across all Q boundaries, summed to a single timeseries. Can be a positive or negative quantity. |
tonnes N |
WQ_MF_NS |
Accumulated nitrate mass fluxes across all WL, WLS and QN boundaries, summed to a single timeseries. Can be a positive or negative quantity. |
tonnes N |
WQ_MF_A_SEDFLX |
Accumulated nitrate mass flux due to sediment consumption or production across the entire domain, summed to a single timeseries. Can be a positive or negative quantity. |
tonnes N |
WQ_MF_A_ATMFLX |
Accumulated nitrate mass flux due to atmospheric exchange across the entire domain, summed to a single timeseries. Always a positive quantity. |
tonnes N |
WQ_MF_V_DRNA |
Accumulated nitrate mass flux due to dissimilatory reduction of nitrate to ammonium across the entire domain, summed to a single timeseries. Always a negative quantity. |
tonnes N |
WQ_MF_V_ANMMOX |
Accumulated nitrate mass flux due to anaerobic oxidation of ammonium to nitrate across the entire domain, summed to a single timeseries. Always a positive quantity. |
tonnes N |
WQ_MF_V_NITRIF |
Accumulated nitrate mass flux due to nitrification across the entire domain, summed to a single timeseries. Always a positive quantity. |
tonnes N |
WQ_MF_V_DENTRF |
Accumulated nitrate mass flux due to denitrification across the entire domain, summed to a single timeseries. Always a negative quantity. |
tonnes N |
WQ_MF_V_PRMPRD_<PN> |
Accumulated nitrate mass flux due to consumption through phytoplankton primary productivity across the entire domain, summed to a single timeseries. The accumulated mass flux is reported separately for each phytoplankton group, so this field will be repeated (with a different <PN> inserted in each column header) for as many columns as there are phytoplankton groups. Always a negative quantity. |
tonnes N |
WQ_MF_TOTAL |
Total of accumulated nitrate mass fluxes, with individual signs preserved. Can be a positive or negative quantity. |
tonnes N |
MF_WQ_MASS |
Estimate of total nitrate mass computed from summing previous timestep nitrate mass (MF_WQ_MASS) and current timestep (not cumulative) nitrate mass fluxes. See Section Q.4 for details. Always a positive quantity. |
tonnes N |
MF_PCT_ERROR |
The percentage difference between FV_WQ_MASS and MF_WQ_MASS. Can be a positive or negative quantity. |
|
MF_TURNOVERS |
See explanatory text above and link to TUFLOW FV documentation (see Section 4.9.2). Always a positive quantity. |
No units |
FRP |
<fvc_name>_MASSBALANCE_WQ_FRP_MG_L.csv |
Units |
TIME |
ISODATE Time |
|
FV_WQ_MASS |
Instantaneous FRP (and adsorbed FRP, if simulated) mass computed from TUFLOW FV state variables. Always a positive quantity. |
tonnes P |
WQ_MF_QC |
Accumulated FRP (and adsorbed FRP, if simulated) mass fluxes across all QC and QC_POLY boundaries, summed to a single timeseries. Can be a positive or negative quantity. |
tonnes P |
WQ_MF_Q |
Accumulated FRP (and adsorbed FRP, if simulated) mass fluxes across all Q boundaries, summed to a single timeseries. Can be a positive or negative quantity. |
tonnes P |
WQ_MF_NS |
Accumulated FRP (and adsorbed FRP, if simulated) mass fluxes across all WL, WLS and QN boundaries, summed to a single timeseries. Can be a positive or negative quantity. |
tonnes P |
WQ_MF_A_SEDFLX |
Accumulated FRP mass flux due to sediment consumption or production across the entire domain, summed to a single timeseries. Can be a positive or negative quantity. |
tonnes P |
WQ_MF_A_ATMFLX |
Accumulated FRP (and adsorbed FRP, if simulated) mass flux due to atmospheric exchange across the entire domain, summed to a single timeseries. Always a positive quantity. |
tonnes P |
WQ_MF_V_ADSDSP |
Accumulated FRP adsorption. This output is not supported so is reported as zeros. Column only included if adsorbed FRP is simulated. |
tonnes P |
WQ_MF_V_SEDMTN |
If simulated, accumulated adsorbed FRP settling to sediments across the entire domain, summed to a single timeseries. Always a negative quantity. |
tonnes P |
WQ_MF_V_PRMPRD_<PN> |
Accumulated FRP mass flux due to consumption through phytoplankton primary productivity across the entire domain, summed to a single timeseries. The accumulated mass flux is reported separately for each phytoplankton group, so this field will be repeated (with a different <PN> inserted in each column header) for as many columns as there are phytoplankton groups. Always a negative quantity. |
tonnes P |
WQ_MF_V_MORTAL_<PN> |
Accumulated FRP mass flux due to production through phytoplankton mortality across the entire domain, summed to a single timeseries. The accumulated mass flux is reported separately for each phytoplankton group, so this field will be repeated (with a different <PN> inserted in each column header) for as many columns as there are phytoplankton groups. Always a positive quantity. |
tonnes P |
WQ_MF_V_EXCRET_<PN> |
Accumulated FRP mass flux due to production through phytoplankton excretion across the entire domain, summed to a single timeseries. The accumulated mass flux is reported separately for each phytoplankton group, so this field will be repeated (with a different <PN> inserted in each column header) for as many columns as there are phytoplankton groups. Always a positive quantity. |
tonnes P |
WQ_MF_TOTAL |
Total of accumulated FRP (and adsorbed FRP, if simulated) mass fluxes, with individual signs preserved. Can be a positive or negative quantity. |
tonnes P |
MF_WQ_MASS |
Estimate of total FRP (and adsorbed FRP, if simulated) mass computed from summing previous timestep ammonium mass (MF_WQ_MASS) and current timestep (not cumulative) ammonium mass fluxes. See Section Q.4 for details. Always a positive quantity. |
tonnes P |
MF_PCT_ERROR |
The percentage difference between FV_WQ_MASS and MF_WQ_MASS. Can be a positive or negative quantity. |
|
MF_TURNOVERS |
See explanatory text above and link to TUFLOW FV documentation (see Section 4.9.2). Always a positive quantity. |
No units |
Phytoplankton |
<fvc_name>_MASSBALANCE_WQ_PHYTO_<PN>_CONC_MICG_L.csv |
Units |
TIME |
ISODATE Time |
|
FV_WQ_MASS |
Instantaneous phytoplankton group mass computed from TUFLOW FV state variables. Always a positive quantity. |
kg Chla |
WQ_MF_QC |
Accumulated phytoplankton group mass fluxes across all QC and QC_POLY boundaries, summed to a single timeseries. Can be a positive or negative quantity. |
kg Chla |
WQ_MF_Q |
Accumulated phytoplankton mass fluxes across all Q boundaries, summed to a single timeseries. Can be a positive or negative quantity. |
kg Chla |
WQ_MF_NS |
Accumulated phytoplankton mass fluxes across all WL, WLS and QN boundaries, summed to a single timeseries. Can be a positive or negative quantity. |
kg Chla |
WQ_MF_V_PRMPRD |
Accumulated phytoplankton mass flux due to primary productivity across the entire domain, summed to a single timeseries. Always a positive quantity. |
kg Chla |
WQ_MF_V_RESPIR |
Accumulated phytoplankton mass flux due to respiration across the entire domain, summed to a single timeseries. Always a negative quantity. |
kg Chla |
WQ_MF_V_MORTAL |
Accumulated phytoplankton mass flux due to mortality across the entire domain, summed to a single timeseries. Always a negative quantity. |
kg Chla |
WQ_MF_V_EXCRET |
Accumulated phytoplankton mass flux due to excretion across the entire domain, summed to a single timeseries. Always a negative quantity. |
kg Chla |
WQ_MF_V_SEDMTN |
Accumulated phytoplankton mass flux due to settling to sediments across the entire domain, summed to a single timeseries. Always a negative quantity. |
kg Chla |
WQ_MF_TOTAL |
Total of accumulated phytoplankton mass fluxes, with individual signs preserved. Can be a positive or negative quantity. |
kg Chla |
MF_WQ_MASS |
Estimate of total phytoplankton mass computed from summing previous timestep phytoplankton mass (MF_WQ_MASS) and current timestep (not cumulative) phytoplankton mass fluxes. See Section Q.4 for details. Always a positive quantity. |
kg Chla |
MF_PCT_ERROR |
The percentage difference between FV_WQ_MASS and MF_WQ_MASS. Can be a positive or negative quantity. |
|
MF_TURNOVERS |
See explanatory text above and link to TUFLOW FV documentation (see Section 4.9.2). Always a positive quantity. |
No units |
| Simulation Class | Organics | |
|---|---|---|
Dissolved Oxygen |
<fvc_name>_MASSBALANCE_WQ_DISS_OXYGEN_MG_L.csv |
Units |
TIME |
ISODATE Time |
|
FV_WQ_MASS |
Instantaneous dissolved oxygen mass computed from TUFLOW FV state variables. Always a positive quantity. |
tonnes O\(_2\) |
WQ_MF_QC |
Accumulated dissolved oxygen mass fluxes across all QC and QC_POLY boundaries, summed to a single timeseries. Can be a positive or negative quantity. |
tonnes O\(_2\) |
WQ_MF_Q |
Accumulated dissolved oxygen mass fluxes across all Q boundaries, summed to a single timeseries. Can be a positive or negative quantity. |
tonnes O\(_2\) |
WQ_MF_NS |
Accumulated dissolved oxygen mass fluxes across all WL, WLS and QN boundaries, summed to a single timeseries. Can be a positive or negative quantity. |
tonnes O\(_2\) |
WQ_MF_A_SEDFLX |
Accumulated dissolved oxygen mass flux due to sediment consumption or production across the entire domain, summed to a single timeseries. Can be a positive or negative quantity. |
tonnes O\(_2\) |
WQ_MF_A_ATMFLX |
Accumulated dissolved oxygen mass flux due to atmospheric exchange across the entire domain, summed to a single timeseries. Can be a positive or negative quantity. |
tonnes O\(_2\) |
WQ_MF_V_NITRIF |
Accumulated dissolved oxygen mass flux due to consumption through nitrification across the entire domain, summed to a single timeseries. Always a negative quantity. |
tonnes O\(_2\) |
WQ_MF_V_AERMIN |
Accumulated dissolved oxygen mass flux due to consumption through aerobic mineralisation of organic matter across the entire domain, summed to a single timeseries. Always a negative quantity. |
tonnes O\(_2\) |
WQ_MF_V_PRMPRD_<PN> |
Accumulated dissolved oxygen mass flux due to production through phytoplankton primary productivity across the entire domain, summed to a single timeseries. The accumulated mass flux is reported separately for each phytoplankton group, so this field will be repeated (with a different <PN> inserted in each column header) for as many columns as there are phytoplankton groups. Always a positive quantity. |
tonnes O\(_2\) |
WQ_MF_V_RESPIR_<PN> |
Accumulated dissolved oxygen mass flux due to consumption through phytoplankton respiration across the entire domain, summed to a single timeseries. The accumulated mass flux is reported separately for each phytoplankton group, so this field will be repeated (with a different <PN> inserted in each column header) for as many columns as there are phytoplankton groups. Always a negative quantity. |
tonnes O\(_2\) |
WQ_MF_TOTAL |
Total of accumulated dissolved oxygen mass fluxes, with individual signs preserved. Can be a positive or negative quantity. |
tonnes O\(_2\) |
MF_WQ_MASS |
Estimate of total dissolved oxygen mass computed from summing previous timestep dissolved oxygen mass (MF_WQ_MASS) and current timestep (not cumulative) dissolved oxygen mass fluxes. See Section Q.4 for details. Always a positive quantity. |
tonnes O\(_2\) |
MF_PCT_ERROR |
The percentage difference between FV_WQ_MASS and MF_WQ_MASS. Can be a positive or negative quantity. |
|
MF_TURNOVERS |
See explanatory text above and link to TUFLOW FV documentation (see Section 4.9.2). Always a positive quantity. |
No units |
Silicate |
<fvc_name>_MASSBALANCE_WQ_SILICATE_MG_L.csv |
Units |
TIME |
ISODATE Time |
|
FV_WQ_MASS |
Instantaneous silicate mass computed from TUFLOW FV state variables. Always a positive quantity. |
tonnes Si |
WQ_MF_QC |
Accumulated silicate mass fluxes across all QC and QC_POLY boundaries, summed to a single timeseries. Can be a positive or negative quantity. |
tonnes Si |
WQ_MF_Q |
Accumulated silicate mass fluxes across all Q boundaries, summed to a single timeseries. Can be a positive or negative quantity. |
tonnes Si |
WQ_MF_NS |
Accumulated silicate mass fluxes across all WL, WLS and QN boundaries, summed to a single timeseries. Can be a positive or negative quantity. |
tonnes Si |
WQ_MF_A_SEDFLX |
Accumulated silicate mass flux due to sediment consumption or production across the entire domain, summed to a single timeseries. Can be a positive or negative quantity. |
tonnes Si |
WQ_MF_V_PRMPRD_<PN> |
Accumulated silicate mass flux due to consumption through phytoplankton primary productivity across the entire domain, summed to a single timeseries. The accumulated mass flux is reported separately for each phytoplankton group that uptakes silicate, so this field will be repeated (with a different <PN> inserted in each column header) for as many columns as there are silicate based phytoplankton groups. No column is included for phytoplankton groups that do not include silicate uptake. Always a negative quantity. |
tonnes Si |
WQ_MF_V_MORTAL_<PN> |
Accumulated silicate mass flux due to production through phytoplankton mortality across the entire domain, summed to a single timeseries. The accumulated mass flux is reported separately for each phytoplankton group that uptakes silicate, so this field will be repeated (with a different <PN> inserted in each column header) for as many columns as there are silicate based phytoplankton groups. No column is included for phytoplankton groups that do not include silicate uptake. Always a positive quantity. |
tonnes Si |
WQ_MF_V_EXCRET_<PN> |
Accumulated silicate mass flux due to production through phytoplankton excretion across the entire domain, summed to a single timeseries. The accumulated mass flux is reported separately for each phytoplankton group that uptakes silicate, so this field will be repeated (with a different <PN> inserted in each column header) for as many columns as there are silicate based phytoplankton groups. No column is included for phytoplankton groups that do not include silicate uptake. Always a positive quantity. |
tonnes Si |
WQ_MF_TOTAL |
Total of accumulated silicate mass fluxes, with individual signs preserved. Can be a positive or negative quantity. |
tonnes Si |
MF_WQ_MASS |
Estimate of total silicate mass computed from summing previous timestep silicate mass (MF_WQ_MASS) and current timestep (not cumulative) silicate mass fluxes. See Section Q.4 for details. Always a positive quantity. |
tonnes Si |
MF_PCT_ERROR |
The percentage difference between FV_WQ_MASS and MF_WQ_MASS. Can be a positive or negative quantity. |
|
MF_TURNOVERS |
See explanatory text above and link to TUFLOW FV documentation (see Section 4.9.2). Always a positive quantity. |
No units |
Ammonium |
<fvc_name>_MASSBALANCE_WQ_AMMONIUM_MG_L.csv |
Units |
TIME |
ISODATE Time |
|
FV_WQ_MASS |
Instantaneous ammonium mass computed from TUFLOW FV state variables. Always a positive quantity. |
tonnes N |
WQ_MF_QC |
Accumulated ammonium mass fluxes across all QC and QC_POLY boundaries, summed to a single timeseries. Can be a positive or negative quantity. |
tonnes N |
WQ_MF_Q |
Accumulated ammonium mass fluxes across all Q boundaries, summed to a single timeseries. Can be a positive or negative quantity. |
tonnes N |
WQ_MF_NS |
Accumulated ammonium mass fluxes across all WL, WLS and QN boundaries, summed to a single timeseries. Can be a positive or negative quantity. |
tonnes N |
WQ_MF_A_SEDFLX |
Accumulated ammonium mass flux due to sediment consumption or production across the entire domain, summed to a single timeseries. Can be a positive or negative quantity. |
tonnes N |
WQ_MF_A_ATMFLX |
Accumulated ammonium mass flux due to atmospheric exchange across the entire domain, summed to a single timeseries. Always a positive quantity. |
tonnes N |
WQ_MF_V_DRNA |
Accumulated ammonium mass flux due to dissimilatory reduction of nitrate to ammonium across the entire domain, summed to a single timeseries. Always a positive quantity. |
tonnes N |
WQ_MF_V_ANMMOX |
Accumulated ammonium mass flux due to anaerobic oxidation of ammonium to nitrate across the entire domain, summed to a single timeseries. Always a negative quantity. |
tonnes N |
WQ_MF_V_NITRIF |
Accumulated ammonium mass flux due to nitrification across the entire domain, summed to a single timeseries. Always a negative quantity. |
tonnes N |
WQ_MF_V_ORGMIN |
Accumulated ammonium mass flux due to mineralisation of labile dissolved organic nitrogen across the entire domain, summed to a single timeseries. Always a positive quantity. |
tonnes N |
WQ_MF_V_PHOTOL |
Accumulated ammonium mass flux due to photolysis of refractory organic nitrogen (if simulated) across the entire domain (if photolysis is switched on), summed to a single timeseries. Always a positive quantity. |
tonnes N |
WQ_MF_V_PRMPRD_<PN> |
Accumulated ammonium mass flux due to consumption through phytoplankton primary productivity across the entire domain, summed to a single timeseries. The accumulated mass flux is reported separately for each phytoplankton group, so this field will be repeated (with a different <PN> inserted in each column header) for as many columns as there are phytoplankton groups. Always a negative quantity. |
tonnes N |
WQ_MF_TOTAL |
Total of accumulated ammonium mass fluxes, with individual signs preserved. Can be a positive or negative quantity. |
tonnes N |
MF_WQ_MASS |
Estimate of total ammonium mass computed from summing previous timestep ammonium mass (MF_WQ_MASS) and current timestep (not cumulative) ammonium mass fluxes. See Section Q.4 for details. Always a positive quantity. |
tonnes N |
MF_PCT_ERROR |
The percentage difference between FV_WQ_MASS and MF_WQ_MASS. Can be a positive or negative quantity. |
|
MF_TURNOVERS |
See explanatory text above and link to TUFLOW FV documentation (see Section 4.9.2). Always a positive quantity. |
No units |
Nitrate |
<fvc_name>_MASSBALANCE_WQ_NITRATE_MG_L.csv |
Units |
TIME |
ISODATE Time |
|
FV_WQ_MASS |
Instantaneous nitrate mass computed from TUFLOW FV state variables. Always a positive quantity. |
tonnes N |
WQ_MF_QC |
Accumulated nitrate mass fluxes across all QC and QC_POLY boundaries, summed to a single timeseries. Can be a positive or negative quantity. |
tonnes N |
WQ_MF_Q |
Accumulated nitrate mass fluxes across all Q boundaries, summed to a single timeseries. Can be a positive or negative quantity. |
tonnes N |
WQ_MF_NS |
Accumulated nitrate mass fluxes across all WL, WLS and QN boundaries, summed to a single timeseries. Can be a positive or negative quantity. |
tonnes N |
WQ_MF_A_SEDFLX |
Accumulated nitrate mass flux due to sediment consumption or production across the entire domain, summed to a single timeseries. Can be a positive or negative quantity. |
tonnes N |
WQ_MF_A_ATMFLX |
Accumulated nitrate mass flux due to atmospheric exchange across the entire domain, summed to a single timeseries. Always a positive quantity. |
tonnes N |
WQ_MF_V_DRNA |
Accumulated nitrate mass flux due to dissimilatory reduction of nitrate to ammonium across the entire domain, summed to a single timeseries. Always a negative quantity. |
tonnes N |
WQ_MF_V_ANMMOX |
Accumulated nitrate mass flux due to anaerobic oxidation of ammonium to nitrate across the entire domain, summed to a single timeseries. Always a positive quantity. |
tonnes N |
WQ_MF_V_NITRIF |
Accumulated nitrate mass flux due to nitrification across the entire domain, summed to a single timeseries. Always a positive quantity. |
tonnes N |
WQ_MF_V_DENTRF |
Accumulated nitrate mass flux due to denitrification across the entire domain, summed to a single timeseries. Always a negative quantity. |
tonnes N |
WQ_MF_V_NO3MIN |
Accumulated nitrogen mass flux due to mineralisation of labile dissolved organic nitrogen (using nitrate as an oxygen source) across the entire domain, summed to a single timeseries. Always a negative quantity. |
tonnes N |
**WQ_MF_V_PRMPRD_<PN> |
Accumulated nitrate mass flux due to consumption through phytoplankton primary productivity across the entire domain, summed to a single timeseries. The accumulated mass flux is reported separately for each phytoplankton group, so this field will be repeated (with a different <PN> inserted in each column header) for as many columns as there are phytoplankton groups. Always a negative quantity. |
tonnes N |
WQ_MF_TOTAL |
Total of accumulated nitrate mass fluxes, with individual signs preserved. Can be a positive or negative quantity. |
tonnes N |
MF_WQ_MASS |
Estimate of total nitrate mass computed from summing previous timestep nitrate mass (MF_WQ_MASS) and current timestep (not cumulative) nitrate mass fluxes. See Section Q.4 for details. Always a positive quantity. |
tonnes N |
MF_PCT_ERROR |
The percentage difference between FV_WQ_MASS and MF_WQ_MASS. Can be a positive or negative quantity. |
|
MF_TURNOVERS |
See explanatory text above and link to TUFLOW FV documentation (see Section 4.9.2). Always a positive quantity. |
No units |
FRP |
<fvc_name>_MASSBALANCE_WQ_FRP_MG_L.csv |
Units |
TIME |
ISODATE Time |
|
FV_WQ_MASS |
Instantaneous FRP (and adsorbed FRP, if simulated) mass computed from TUFLOW FV state variables. Always a positive quantity. |
tonnes P |
WQ_MF_QC |
Accumulated FRP (and adsorbed FRP, if simulated) mass fluxes across all QC and QC_POLY boundaries, summed to a single timeseries. Can be a positive or negative quantity. |
tonnes P |
WQ_MF_Q |
Accumulated FRP (and adsorbed FRP, if simulated) mass fluxes across all Q boundaries, summed to a single timeseries. Can be a positive or negative quantity. |
tonnes P |
WQ_MF_NS |
Accumulated FRP (and adsorbed FRP, if simulated) mass fluxes across all WL, WLS and QN boundaries, summed to a single timeseries. Can be a positive or negative quantity. |
tonnes P |
WQ_MF_A_SEDFLX |
Accumulated FRP mass flux due to sediment consumption or production across the entire domain, summed to a single timeseries. Can be a positive or negative quantity. |
tonnes P |
WQ_MF_A_ATMFLX |
Accumulated FRP (and adsorbed FRP, if simulated) mass flux due to atmospheric exchange across the entire domain, summed to a single timeseries. Always a positive quantity. |
tonnes P |
WQ_MF_V_ADSDSP |
Accumulated FRP adsorption. This output is not supported so is reported as zeros. Column only included if adsorbed FRP is simulated. |
tonnes P |
WQ_MF_V_SEDMTN |
If simulated, accumulated adsorbed FRP settling to sediments across the entire domain, summed to a single timeseries. Always a negative quantity. |
tonnes P |
WQ_MF_V_ORGMIN |
Accumulated FRP mass flux due to mineralisation of labile dissolved organic phosphorus across the entire domain, summed to a single timeseries. Always a positive quantity. |
tonnes P |
WQ_MF_V_PHOTOL |
Accumulated FRP mass flux due to photolysis of refractory organic phosphorus (if simulated) across the entire domain (if photolysis is switched on), summed to a single timeseries. Always a positive quantity. |
tonnes P |
WQ_MF_V_PRMPRD_<PN> |
Accumulated FRP mass flux due to consumption through phytoplankton primary productivity across the entire domain, summed to a single timeseries. The accumulated mass flux is reported separately for each phytoplankton group, so this field will be repeated (with a different <PN> inserted in each column header) for as many columns as there are phytoplankton groups. Always a negative quantity. |
tonnes P |
WQ_MF_TOTAL |
Total of accumulated FRP (and adsorbed FRP, if simulated) mass fluxes, with individual signs preserved. Can be a positive or negative quantity. |
tonnes P |
MF_WQ_MASS |
Estimate of total FRP (and adsorbed FRP, if simulated) mass computed from summing previous timestep ammonium mass (MF_WQ_MASS) and current timestep (not cumulative) ammonium mass fluxes. See Section Q.4 for details. Always a positive quantity. |
tonnes P |
MF_PCT_ERROR |
The percentage difference between FV_WQ_MASS and MF_WQ_MASS. Can be a positive or negative quantity. |
|
MF_TURNOVERS |
See explanatory text above and link to TUFLOW FV documentation (see Section 4.9.2). Always a positive quantity. |
No units |
Labile dissolved organic carbon |
<fvc_name>_MASSBALANCE_WQ_DOC_MG_L.csv |
Units |
TIME |
ISODATE Time |
|
FV_WQ_MASS |
Instantaneous labile dissolved organic carbon mass computed from TUFLOW FV state variables. Always a positive quantity. |
tonnes C |
WQ_MF_QC |
Accumulated labile dissolved organic carbon mass fluxes across all QC and QC_POLY boundaries, summed to a single timeseries. Can be a positive or negative quantity. |
tonnes C |
WQ_MF_Q |
Accumulated labile dissolved organic carbon mass fluxes across all Q boundaries, summed to a single timeseries. Can be a positive or negative quantity. |
tonnes C |
WQ_MF_NS |
Accumulated labile dissolved organic carbon mass fluxes across all WL, WLS and QN boundaries, summed to a single timeseries. Can be a positive or negative quantity. |
tonnes C |
WQ_MF_A_SEDFLX |
Accumulated labile dissolved organic carbon mass flux due to sediment consumption or production across the entire domain, summed to a single timeseries. Can be a positive or negative quantity. |
tonnes C |
WQ_MF_V_HYDLSS |
Accumulated labile dissolved organic carbon mass flux due to hydrolysis of labile particulate organic carbon across the entire domain, summed to a single timeseries. Always a positive quantity. |
tonnes C |
WQ_MF_V_ORGMIN |
Accumulated labile dissolved organic carbon mass flux due to mineralisation of labile dissolved organic carbon across the entire domain, summed to a single timeseries. Always a negative quantity. |
tonnes C |
WQ_MF_V_ACTIVN |
Accumulated labile dissolved organic carbon mass flux due to activation of refractory dissolved organic carbon (if simulated) across the entire domain, summed to a single timeseries. Always a positive quantity. |
tonnes C |
WQ_MF_V_PHOTOL |
Accumulated labile dissolved organic carbon mass flux due to photolysis of refractory organic carbon (if simulated) across the entire domain (if photolysis is switched on), summed to a single timeseries. Always a positive quantity. |
tonnes C |
WQ_MF_V_EXCRET_<PN> |
Accumulated labile dissolved organic carbon mass flux due to production through phytoplankton excretion across the entire domain, summed to a single timeseries. The accumulated mass flux is reported separately for each phytoplankton group, so this field will be repeated (with a different <PN> inserted in each column header) for as many columns as there are phytoplankton groups. Always a positive quantity. |
tonnes C |
WQ_MF_TOTAL |
Total of accumulated labile dissolved organic carbon mass fluxes, with individual signs preserved. Can be a positive or negative quantity. |
tonnes C |
MF_WQ_MASS |
Estimate of total labile dissolved organic carbon mass computed from summing previous timestep labile dissolved organic carbon mass (MF_WQ_MASS) and current timestep (not cumulative) labile dissolved organic carbon mass fluxes. See Section Q.4 for details. Always a positive quantity. |
tonnes C |
MF_PCT_ERROR |
The percentage difference between FV_WQ_MASS and MF_WQ_MASS. Can be a positive or negative quantity. |
|
MF_TURNOVERS |
See explanatory text above and link to TUFLOW FV documentation (see Section 4.9.2). Always a positive quantity. |
No units |
Labile particulate organic carbon |
<fvc_name>_MASSBALANCE_WQ_POC_MG_L.csv |
Units |
TIME |
ISODATE Time |
|
FV_WQ_MASS |
Instantaneous labile particulate organic carbon mass computed from TUFLOW FV state variables. Always a positive quantity. |
tonnes C |
WQ_MF_QC |
Accumulated labile particulate organic carbon mass fluxes across all QC and QC_POLY boundaries, summed to a single timeseries. Can be a positive or negative quantity. |
tonnes C |
WQ_MF_Q |
Accumulated labile particulate organic carbon mass fluxes across all Q boundaries, summed to a single timeseries. Can be a positive or negative quantity. |
tonnes C |
WQ_MF_NS |
Accumulated labile particulate organic carbon mass fluxes across all WL, WLS and QN boundaries, summed to a single timeseries. Can be a positive or negative quantity. |
tonnes C |
WQ_MF_V_HYDLSS |
Accumulated labile particulate organic carbon mass flux due to hydrolysis of labile particulate organic carbon across the entire domain, summed to a single timeseries. Always a negative quantity. |
tonnes C |
WQ_MF_V_SEDMTN |
Accumulated labile particulate organic carbon mass settling to sediments across the entire domain, summed to a single timeseries. Always a negative quantity. |
tonnes C |
WQ_MF_V_BRKDWN |
Accumulated labile particulate organic carbon mass flux due to the breakdown of refractory particulate organic matter (if simulated) across the entire domain, summed to a single timeseries. Always a positive quantity. |
tonnes C |
WQ_MF_V_MORTAL_<PN> |
Accumulated labile particulate organic carbon mass flux due to production through phytoplankton mortality across the entire domain, summed to a single timeseries. The accumulated mass flux is reported separately for each phytoplankton group, so this field will be repeated (with a different <PN> inserted in each column header) for as many columns as there are phytoplankton groups. Always a positive quantity. |
tonnes C |
WQ_MF_TOTAL |
Total of accumulated labile particulate organic carbon mass fluxes, with individual signs preserved. Can be a positive or negative quantity. |
tonnes C |
MF_WQ_MASS |
Estimate of total labile particulate organic carbon mass computed from summing previous timestep labile particulate organic carbon mass (MF_WQ_MASS) and current timestep (not cumulative) labile particulate organic carbon mass fluxes. See Section Q.4 for details. Always a positive quantity. |
tonnes C |
MF_PCT_ERROR |
The percentage difference between FV_WQ_MASS and MF_WQ_MASS. Can be a positive or negative quantity. |
|
MF_TURNOVERS |
See explanatory text above and link to TUFLOW FV documentation (see Section 4.9.2). Always a positive quantity. |
No units |
Labile dissolved organic nitrogen |
<fvc_name>_MASSBALANCE_WQ_DON_MG_L.csv |
Units |
TIME |
ISODATE Time |
|
FV_WQ_MASS |
Instantaneous labile dissolved organic nitrogen mass computed from TUFLOW FV state variables. Always a positive quantity. |
tonnes N |
WQ_MF_QC |
Accumulated labile dissolved organic nitrogen mass fluxes across all QC and QC_POLY boundaries, summed to a single timeseries. Can be a positive or negative quantity. |
tonnes N |
WQ_MF_Q |
Accumulated labile dissolved organic nitrogen mass fluxes across all Q boundaries, summed to a single timeseries. Can be a positive or negative quantity. |
tonnes N |
WQ_MF_NS |
Accumulated labile dissolved organic nitrogen mass fluxes across all WL, WLS and QN boundaries, summed to a single timeseries. Can be a positive or negative quantity. |
tonnes N |
WQ_MF_A_SEDFLX |
Accumulated labile dissolved organic nitrogen mass flux due to sediment consumption or production across the entire domain, summed to a single timeseries. Can be a positive or negative quantity. |
tonnes N |
WQ_MF_V_HYDLSS |
Accumulated labile dissolved organic nitrogen mass flux due to hydrolysis of labile particulate organic nitrogen across the entire domain, summed to a single timeseries. Always a positive quantity. |
tonnes N |
WQ_MF_V_ORGMIN |
Accumulated labile dissolved organic nitrogen mass flux due to mineralisation of labile dissolved organic nitrogen across the entire domain, summed to a single timeseries. Always a negative quantity. |
tonnes N |
WQ_MF_V_ACTIVN |
Accumulated labile dissolved organic nitrogen mass flux due to activation of refractory dissolved organic nitrogen (if simulated) across the entire domain, summed to a single timeseries. Always a positive quantity. |
tonnes N |
WQ_MF_V_PHOTOL |
Accumulated labile dissolved organic nitrogen mass flux due to photolysis of refractory organic nitrogen (if simulated) across the entire domain (if photolysis is switched on), summed to a single timeseries. Always a positive quantity. |
tonnes N |
WQ_MF_V_EXCRET_<PN> |
Accumulated labile dissolved organic nitrogen mass flux due to production through phytoplankton excretion across the entire domain, summed to a single timeseries. The accumulated mass flux is reported separately for each phytoplankton group, so this field will be repeated (with a different <PN> inserted in each column header) for as many columns as there are phytoplankton groups. Always a positive quantity. |
tonnes N |
WQ_MF_TOTAL |
Total of accumulated labile dissolved organic nitrogen mass fluxes, with individual signs preserved. Can be a positive or negative quantity. |
tonnes N |
MF_WQ_MASS |
Estimate of total labile dissolved organic nitrogen mass computed from summing previous timestep labile dissolved organic nitrogen mass (MF_WQ_MASS) and current timestep (not cumulative) labile dissolved organic nitrogen mass fluxes. See Section Q.4 for details. Always a positive quantity. |
tonnes N |
MF_PCT_ERROR |
The percentage difference between FV_WQ_MASS and MF_WQ_MASS. Can be a positive or negative quantity. |
|
MF_TURNOVERS |
See explanatory text above and link to TUFLOW FV documentation (see Section 4.9.2). Always a positive quantity. |
No units |
Labile particulate organic nitrogen |
<fvc_name>_MASSBALANCE_WQ_PON_MG_L.csv |
Units |
TIME |
ISODATE Time |
|
FV_WQ_MASS |
Instantaneous labile particulate organic nitrogen mass computed from TUFLOW FV state variables. Always a positive quantity. |
tonnes N |
WQ_MF_QC |
Accumulated labile particulate organic nitrogen mass fluxes across all QC and QC_POLY boundaries, summed to a single timeseries. Can be a positive or negative quantity. |
tonnes N |
WQ_MF_Q |
Accumulated labile particulate organic nitrogen mass fluxes across all Q boundaries, summed to a single timeseries. Can be a positive or negative quantity. |
tonnes N |
WQ_MF_NS |
Accumulated labile particulate organic nitrogen mass fluxes across all WL, WLS and QN boundaries, summed to a single timeseries. Can be a positive or negative quantity. |
tonnes N |
WQ_MF_V_HYDLSS |
Accumulated labile particulate organic nitrogen mass flux due to hydrolysis of labile particulate organic nitrogen across the entire domain, summed to a single timeseries. Always a negative quantity. |
tonnes N |
WQ_MF_V_SEDMTN |
Accumulated labile particulate organic nitrogen mass settling to sediments across the entire domain, summed to a single timeseries. Always a negative quantity. |
tonnes N |
WQ_MF_V_BRKDWN |
Accumulated labile particulate organic nitrogen mass flux due to the breakdown of refractory particulate organic matter (if simulated) across the entire domain, summed to a single timeseries. Always a positive quantity. |
tonnes N |
WQ_MF_V_MORTAL_<PN> |
Accumulated labile particulate organic nitrogen mass flux due to production through phytoplankton mortality across the entire domain, summed to a single timeseries. The accumulated mass flux is reported separately for each phytoplankton group, so this field will be repeated (with a different <PN> inserted in each column header) for as many columns as there are phytoplankton groups. Always a positive quantity. |
tonnes N |
WQ_MF_TOTAL |
Total of accumulated labile particulate organic nitrogen mass fluxes, with individual signs preserved. Can be a positive or negative quantity. |
tonnes N |
MF_WQ_MASS |
Estimate of total labile particulate organic nitrogen mass computed from summing previous timestep labile particulate organic nitrogen mass (MF_WQ_MASS) and current timestep (not cumulative) labile particulate organic nitrogen mass fluxes. See Section Q.4 for details. Always a positive quantity. |
tonnes N |
MF_PCT_ERROR |
The percentage difference between FV_WQ_MASS and MF_WQ_MASS. Can be a positive or negative quantity. |
|
MF_TURNOVERS |
See explanatory text above and link to TUFLOW FV documentation (see Section 4.9.2). Always a positive quantity. |
No units |
Labile dissolved organic phosphorus |
<fvc_name>_MASSBALANCE_WQ_DOP_MG_L.csv |
Units |
TIME |
ISODATE Time |
|
FV_WQ_MASS |
Instantaneous labile dissolved organic phosphorus mass computed from TUFLOW FV state variables. Always a positive quantity. |
tonnes P |
WQ_MF_QC |
Accumulated labile dissolved organic phosphorus mass fluxes across all QC and QC_POLY boundaries, summed to a single timeseries. Can be a positive or negative quantity. |
tonnes P |
WQ_MF_Q |
Accumulated labile dissolved organic phosphorus mass fluxes across all Q boundaries, summed to a single timeseries. Can be a positive or negative quantity. |
tonnes P |
WQ_MF_NS |
Accumulated labile dissolved organic phosphorus mass fluxes across all WL, WLS and QN boundaries, summed to a single timeseries. Can be a positive or negative quantity. |
tonnes P |
WQ_MF_A_SEDFLX |
Accumulated labile dissolved organic phosphorus mass flux due to sediment consumption or production across the entire domain, summed to a single timeseries. Can be a positive or negative quantity. |
tonnes P |
WQ_MF_V_HYDLSS |
Accumulated labile dissolved organic phosphorus mass flux due to hydrolysis of labile particulate organic phosphorus across the entire domain, summed to a single timeseries. Always a positive quantity. |
tonnes P |
WQ_MF_V_ORGMIN |
Accumulated labile dissolved organic phosphorus mass flux due to mineralisation of labile dissolved organic phosphorus across the entire domain, summed to a single timeseries. Always a negative quantity. |
tonnes P |
WQ_MF_V_ACTIVN |
Accumulated labile dissolved organic phosphorus mass flux due to activation of refractory dissolved organic phosphorus (if simulated) across the entire domain, summed to a single timeseries. Always a positive quantity. |
tonnes P |
WQ_MF_V_PHOTOL |
Accumulated labile dissolved organic phosphorus mass flux due to photolysis of refractory organic phosphorus (if simulated) across the entire domain (if photolysis is switched on), summed to a single timeseries. Always a positive quantity. |
tonnes P |
WQ_MF_V_EXCRET_<PN> |
Accumulated labile dissolved organic phosphorus mass flux due to production through phytoplankton excretion across the entire domain, summed to a single timeseries. The accumulated mass flux is reported separately for each phytoplankton group, so this field will be repeated (with a different <PN> inserted in each column header) for as many columns as there are phytoplankton groups. Always a positive quantity. |
tonnes P |
WQ_MF_TOTAL |
Total of accumulated labile dissolved organic phosphorus mass fluxes, with individual signs preserved. Can be a positive or negative quantity. |
tonnes P |
MF_WQ_MASS |
Estimate of total labile dissolved organic phosphorus mass computed from summing previous timestep labile dissolved organic phosphorus mass (MF_WQ_MASS) and current timestep (not cumulative) labile dissolved organic phosphorus mass fluxes. See Section Q.4) for details. Always a positive quantity. |
tonnes P |
MF_PCT_ERROR |
The percentage difference between FV_WQ_MASS and MF_WQ_MASS. Can be a positive or negative quantity. |
|
MF_TURNOVERS |
See explanatory text above and link to TUFLOW FV documentation (see Section 4.9.2). Always a positive quantity. |
No units |
Labile particulate organic phosphorus |
<fvc_name>_MASSBALANCE_WQ_POP_MG_L.csv |
Units |
TIME |
ISODATE Time |
|
FV_WQ_MASS |
Instantaneous labile particulate organic phosphorus mass computed from TUFLOW FV state variables. Always a positive quantity. |
tonnes P |
WQ_MF_QC |
Accumulated labile particulate organic phosphorus mass fluxes across all QC and QC_POLY boundaries, summed to a single timeseries. Can be a positive or negative quantity. |
tonnes P |
WQ_MF_Q |
Accumulated labile particulate organic phosphorus mass fluxes across all Q boundaries, summed to a single timeseries. Can be a positive or negative quantity. |
tonnes P |
WQ_MF_NS |
Accumulated labile particulate organic phosphorus mass fluxes across all WL, WLS and QN boundaries, summed to a single timeseries. Can be a positive or negative quantity. |
tonnes P |
WQ_MF_V_HYDLSS |
Accumulated labile particulate organic phosphorus mass flux due to hydrolysis of labile particulate organic phosphorus across the entire domain, summed to a single timeseries. Always a negative quantity. |
tonnes P |
WQ_MF_V_SEDMTN |
Accumulated labile particulate organic phosphorus mass settling to sediments across the entire domain, summed to a single timeseries. Always a negative quantity. |
tonnes P |
WQ_MF_V_BRKDWN |
Accumulated labile particulate organic phosphorus mass flux due to the breakdown of refractory particulate organic matter (if simulated) across the entire domain, summed to a single timeseries. Always a positive quantity. |
tonnes P |
WQ_MF_V_MORTAL_<PN> |
Accumulated labile particulate organic phosphorus mass flux due to production through phytoplankton mortality across the entire domain, summed to a single timeseries. The accumulated mass flux is reported separately for each phytoplankton group, so this field will be repeated (with a different <PN> inserted in each column header) for as many columns as there are phytoplankton groups. Always a positive quantity. |
tonnes P |
WQ_MF_TOTAL |
Total of accumulated labile particulate organic phosphorus mass fluxes, with individual signs preserved. Can be a positive or negative quantity. |
tonnes P |
MF_WQ_MASS |
Estimate of total labile particulate organic phosphorus mass computed from summing previous timestep labile particulate organic phosphorus mass (MF_WQ_MASS) and current timestep (not cumulative) labile particulate organic phosphorus mass fluxes. See Section Q.4 for details. Always a positive quantity. |
tonnes P |
MF_PCT_ERROR |
The percentage difference between FV_WQ_MASS and MF_WQ_MASS. Can be a positive or negative quantity. |
|
MF_TURNOVERS |
See explanatory text above and link to TUFLOW FV documentation (see Section 4.9.2). Always a positive quantity. |
No units |
Refractory dissolved organic carbon |
<fvc_name>_MASSBALANCE_WQ_RDOC_MG_L.csv |
Units |
TIME |
ISODATE Time |
|
FV_WQ_MASS |
Instantaneous refractory dissolved organic carbon mass computed from TUFLOW FV state variables. Always a positive quantity. |
tonnes C |
WQ_MF_QC |
Accumulated refractory dissolved organic carbon mass fluxes across all QC and QC_POLY boundaries, summed to a single timeseries. Can be a positive or negative quantity. |
tonnes C |
WQ_MF_Q |
Accumulated refractory dissolved organic carbon mass fluxes across all Q boundaries, summed to a single timeseries. Can be a positive or negative quantity. |
tonnes C |
WQ_MF_NS |
Accumulated refractory dissolved organic carbon mass fluxes across all WL, WLS and QN boundaries, summed to a single timeseries. Can be a positive or negative quantity. |
tonnes C |
WQ_MF_V_ACTIVN |
Accumulated refractory dissolved organic carbon mass flux due to activation of refractory dissolved organic carbon (if simulated) across the entire domain, summed to a single timeseries. Always a negative quantity. |
tonnes C |
WQ_MF_V_PHOTOL |
Accumulated refractory dissolved organic carbon mass flux due to photolysis of refractory organic carbon (if simulated) across the entire domain (if photolysis is switched on), summed to a single timeseries. Always a negative quantity. |
tonnes C |
WQ_MF_TOTAL |
Total of accumulated refractory dissolved organic carbon mass fluxes, with individual signs preserved. Can be a positive or negative quantity. |
tonnes C |
MF_WQ_MASS |
Estimate of total refractory dissolved organic carbon mass computed from summing previous timestep refractory dissolved organic carbon mass (MF_WQ_MASS) and current timestep (not cumulative) refractory dissolved organic carbon mass fluxes. See Section Q.4 for details. Always a positive quantity. |
tonnes C |
MF_PCT_ERROR |
The percentage difference between FV_WQ_MASS and MF_WQ_MASS. Can be a positive or negative quantity. |
|
MF_TURNOVERS |
See explanatory text above and link to TUFLOW FV documentation (see Section 4.9.2). Always a positive quantity. |
No units |
Refractory dissolved organic nitrogen |
<fvc_name>_MASSBALANCE_WQ_RDON_MG_L.csv |
Units |
TIME |
ISODATE Time |
|
FV_WQ_MASS |
Instantaneous refractory dissolved organic nitrogen mass computed from TUFLOW FV state variables. Always a positive quantity. |
tonnes N |
WQ_MF_QC |
Accumulated refractory dissolved organic nitrogen mass fluxes across all QC and QC_POLY boundaries, summed to a single timeseries. Can be a positive or negative quantity. |
tonnes N |
WQ_MF_Q |
Accumulated refractory dissolved organic nitrogen mass fluxes across all Q boundaries, summed to a single timeseries. Can be a positive or negative quantity. |
tonnes N |
WQ_MF_NS |
Accumulated refractory dissolved organic nitrogen mass fluxes across all WL, WLS and QN boundaries, summed to a single timeseries. Can be a positive or negative quantity. |
tonnes N |
WQ_MF_V_ACTIVN |
Accumulated refractory dissolved organic nitrogen mass flux due to activation of refractory dissolved organic nitrogen (if simulated) across the entire domain, summed to a single timeseries. Always a negative quantity. |
tonnes N |
WQ_MF_V_PHOTOL |
Accumulated refractory dissolved organic nitrogen mass flux due to photolysis of refractory organic nitrogen (if simulated) across the entire domain (if photolysis is switched on), summed to a single timeseries. Always a negative quantity. |
tonnes N |
WQ_MF_TOTAL |
Total of accumulated refractory dissolved organic nitrogen mass fluxes, with individual signs preserved. Can be a positive or negative quantity. |
tonnes N |
MF_WQ_MASS |
Estimate of total refractory dissolved organic nitrogen mass computed from summing previous timestep refractory dissolved organic nitrogen mass (MF_WQ_MASS) and current timestep (not cumulative) refractory dissolved organic nitrogen mass fluxes. See Section Q.4 for details. Always a positive quantity. |
tonnes N |
MF_PCT_ERROR |
The percentage difference between FV_WQ_MASS and MF_WQ_MASS. Can be a positive or negative quantity. |
|
MF_TURNOVERS |
See explanatory text above and link to TUFLOW FV documentation (see Section 4.9.2). Always a positive quantity. |
No units |
Refractory dissolved organic phosphorus |
<fvc_name>_MASSBALANCE_WQ_RDOP_MG_L.csv |
Units |
TIME |
ISODATE Time |
|
FV_WQ_MASS |
Instantaneous refractory dissolved organic phosphorus mass computed from TUFLOW FV state variables. Always a positive quantity. |
tonnes P |
WQ_MF_QC |
Accumulated refractory dissolved organic phosphorus mass fluxes across all QC and QC_POLY boundaries, summed to a single timeseries. Can be a positive or negative quantity. |
tonnes P |
WQ_MF_Q |
Accumulated refractory dissolved organic phosphorus mass fluxes across all Q boundaries, summed to a single timeseries. Can be a positive or negative quantity. |
tonnes P |
WQ_MF_NS |
Accumulated refractory dissolved organic phosphorus mass fluxes across all WL, WLS and QN boundaries, summed to a single timeseries. Can be a positive or negative quantity. |
tonnes P |
WQ_MF_V_ACTIVN |
Accumulated refractory dissolved organic phosphorus mass flux due to activation of refractory dissolved organic phosphorus (if simulated) across the entire domain, summed to a single timeseries. Always a negative quantity. |
tonnes P |
WQ_MF_V_PHOTOL |
Accumulated refractory dissolved organic phosphorus mass flux due to photolysis of refractory organic phosphorus (if simulated) across the entire domain (if photolysis is switched on), summed to a single timeseries. Always a negative quantity. |
tonnes P |
WQ_MF_TOTAL |
Total of accumulated refractory dissolved organic phosphorus mass fluxes, with individual signs preserved. Can be a positive or negative quantity. |
tonnes P |
MF_WQ_MASS |
Estimate of total refractory dissolved organic phosphorus mass computed from summing previous timestep refractory dissolved organic phosphorus mass (MF_WQ_MASS) and current timestep (not cumulative) refractory dissolved organic phosphorus mass fluxes. See Section Q.4 for details. Always a positive quantity. |
tonnes P |
MF_PCT_ERROR |
The percentage difference between FV_WQ_MASS and MF_WQ_MASS. Can be a positive or negative quantity. |
|
MF_TURNOVERS |
See explanatory text above and link to TUFLOW FV documentation (see Section 4.9.2). Always a positive quantity. |
No units |
Refractory particulate organic matter |
<fvc_name>_MASSBALANCE_WQ_RPOM_MG_L.csv |
Units |
TIME |
ISODATE Time |
|
FV_WQ_MASS |
Instantaneous refractory particulate organic matter mass computed from TUFLOW FV state variables. Always a positive quantity. |
tonnes C |
WQ_MF_QC |
Accumulated refractory particulate organic matter mass fluxes across all QC and QC_POLY boundaries, summed to a single timeseries. Can be a positive or negative quantity. |
tonnes C |
WQ_MF_Q |
Accumulated refractory particulate organic matter mass fluxes across all Q boundaries, summed to a single timeseries. Can be a positive or negative quantity. |
tonnes C |
WQ_MF_NS |
Accumulated refractory particulate organic matter mass fluxes across all WL, WLS and QN boundaries, summed to a single timeseries. Can be a positive or negative quantity. |
tonnes C |
WQ_MF_V_BRKDWN |
Accumulated refractory particulate organic matter mass flux due to breakdown of refractory particulate organic matter (if simulated) across the entire domain, summed to a single timeseries. Always a negative quantity. |
tonnes C |
WQ_MF_V_SEDMTN |
Accumulated refractory particulate organic matter mass settling to sediments across the entire domain, summed to a single timeseries. Always a negative quantity. |
tonnes C |
WQ_MF_TOTAL |
Total of accumulated refractory particulate organic matter mass fluxes, with individual signs preserved. Can be a positive or negative quantity. |
tonnes C |
MF_WQ_MASS |
Estimate of total refractory particulate organic matter mass computed from summing previous timestep refractory particulate organic matter mass (MF_WQ_MASS) and current timestep (not cumulative) refractory particulate organic matter mass fluxes. See Section Q.4 for details. Always a positive quantity. |
tonnes C |
MF_PCT_ERROR |
The percentage difference between FV_WQ_MASS and MF_WQ_MASS. Can be a positive or negative quantity. |
|
MF_TURNOVERS |
See explanatory text above and link to TUFLOW FV documentation (see Section 4.9.2). Always a positive quantity. |
No units |
Phytoplankton |
<fvc_name>_MASSBALANCE_WQ_PHYTO_<PN>_CONC_MICG_L.csv |
Units |
TIME |
ISODATE Time |
|
FV_WQ_MASS |
Instantaneous phytoplankton group mass computed from TUFLOW FV state variables. Always a positive quantity. |
kg Chla |
WQ_MF_QC |
Accumulated phytoplankton group mass fluxes across all QC and QC_POLY boundaries, summed to a single timeseries. Can be a positive or negative quantity. |
kg Chla |
WQ_MF_Q |
Accumulated phytoplankton mass fluxes across all Q boundaries, summed to a single timeseries. Can be a positive or negative quantity. |
kg Chla |
WQ_MF_NS |
Accumulated phytoplankton mass fluxes across all WL, WLS and QN boundaries, summed to a single timeseries. Can be a positive or negative quantity. |
kg Chla |
WQ_MF_V_PRMPRD |
Accumulated phytoplankton mass flux due to primary productivity across the entire domain, summed to a single timeseries. Always a positive quantity. |
kg Chla |
WQ_MF_V_RESPIR |
Accumulated phytoplankton mass flux due to respiration across the entire domain, summed to a single timeseries. Always a negative quantity. |
kg Chla |
WQ_MF_V_MORTAL |
Accumulated phytoplankton mass flux due to mortality across the entire domain, summed to a single timeseries. Always a negative quantity. |
kg Chla |
WQ_MF_V_EXCRET |
Accumulated phytoplankton mass flux due to excretion across the entire domain, summed to a single timeseries. Always a negative quantity. |
kg Chla |
WQ_MF_V_SEDMTN |
Accumulated phytoplankton mass flux due to settling to sediments across the entire domain, summed to a single timeseries. Always a negative quantity. |
kg Chla |
WQ_MF_TOTAL |
Total of accumulated phytoplankton mass fluxes, with individual signs preserved. Can be a positive or negative quantity. |
kg Chla |
MF_WQ_MASS |
Estimate of total phytoplankton mass computed from summing previous timestep phytoplankton mass (MF_WQ_MASS) and current timestep (not cumulative) phytoplankton mass fluxes. See Section Q.4 for details. Always a positive quantity. |
kg Chla |
MF_PCT_ERROR |
The percentage difference between FV_WQ_MASS and MF_WQ_MASS. Can be a positive or negative quantity. |
|
MF_TURNOVERS |
See explanatory text above and link to TUFLOW FV documentation (see Section 4.9.2). Always a positive quantity. |
No units |
4.9.3 Units
All output units are as set by the user (i.e. either the mg/L or mmol/m\(^3\) systems, noting that the latter is not supported by the mass balance outputs).
In binary outputs (i.e. NetCDF and DatV outputs) quantities are reported simply in the simulated units. The names of variables in these binary files will also denote the units of reporting. For example, dissolved oxygen concentrations reported in a three dimensional NetCDF file that was generated by a mg/L water quality simulation will:
- Be in units of mg/L. A reported value of “6.5” will be 6.5 mg/L
- Have the variable name WQ_DISS_OXYGEN_MG_L
In text based outputs (i.e. mass, flux and points outputs), units are reported in column headers. For consistency, SI units of kg, m\(^3\) and seconds are used to report in the mg/L system. In the mmol system, reporting units are moles, m\(^3\) and seconds. In both cases, these units may also deploy engineering notation (e.g. “x10^3” or “x10^6”) so that text field outputs are manageable. In these cases, the reported numbers in the columns have been multiplied by the noted magnitude in each header before being written to file. For example, a unit header of “x10^3 kg” that subsequently reports a value of “4,000”, indicates that the simulated quantity was actually “4” kg - the simulated quantity has been multiplied by 10^3 before being reported. Some specific examples of header notated units, and their simplifications include:
- mg/L system:
- “x 10^3 kg m^-3” is mg/L
- “x 10^6 kg Chla m^-3” is \(\mu\)g/L
- “x 10^3 kg” is grams
- “x 10^6 kg” is milligrams
- “x 10^3 kg s^-1” is grams per second
- mmol/m\(^3\) system:
- “x 10^3 mol m^-3” is mmol/m\(^3\)
- “x 10^3 mol” is mmol
- “x 10^3 mol s^-1” is millimoles per second
Another way of thinking about this conversion is that if a unit is reported as “x 10^z units”, then the reported quantity needs to be divided by 10\(^z\) to recover the original quantity in “units”.
For diagnostic variables, the outputting of “points” (which are depth averaged), “mass” and “flux” files is rarely meaningful and should be avoided. No support for units of these output types is therefore provided. Binary files of these outputs are meaningful (they are used in the mass balance analysis for example) so have the units of each diagnostic denoted in its name (e.g. “WQ_DIAG_FRP_ADS_SEDMTN_FLUX_MG_M2_D” is in mg/m\(^2\)/day).
