Section 2 Hydrodynamic Engine Updates and Enhancements
2.1 BC Headers
Within a BC block users can now specify boundary condition headers, scale and offset commands independently for hydrodynamics, sediment, tracers and water quality. This decouples the previous single line ordering required for specification of these quantities across modules. This effective subdivision of a previous single BC block’s commands is:
- Hydrodynamics
BC Header == BC Scale == BC Offset == BC Default ==
- Sediment
Sed Header == Sed Scale == Sed Offset == Sed Default ==
- Tracer
Trace Header == Trace Scale == Trace Offset == Trace Default ==
- Water Quality
WQ Header == WQ Scale == WQ Offset == WQ Default ==
For example, if a model uses the QC boundary condition type, with salinity, temperature, one sediment fraction, one tracer, and one water quality constituent included, the legacy BC block would be written as shown in the below example.
As of TUFLOW FV 2025.0.0, this can be rewritten as follows.
This new approach means that, for example, an additional sediment fraction can be added to the simulation and added to the QC BC block without impacting the subsequent tracer or water quality BC commands.
Notes:
- If users specify headers/scale/offset/default in both the
BC Header == ,BC Scale == ,BC Offset == , andBC Default == commands and any of the subsequent sediment, tracer, or WQ BC commands within a BC block, the values defined in the subsequent sediment/tracer/WQ specification commands will overwrite theBC Header == ,BC Scale == ,BC Offset == , andBC Default == commands - It is recommended to use the BC header/scale/offset/default commands for hydrodynamic, salinity, and temperature headers/scale/offset/default only, while using the sediment, tracer, and WQ-specific commands for their respective variables
- Reference to the boundary condition time variable should only be specified by the
BC Header == command. Time should not be repeated for any of theSed Header == ,Trace Header == , orWQ Header == commands - When salinity or temperature functionality is disabled (e.g.,
Include Salinity == 0, 0 ), theBC Header == line should be updated accordingly to remove salinity. If this is not undertaken then the undeleted salinity entries will be interpreted as temperature entries - Users should always check the log file to verify that the BC variable names match the expected headers in the BC file
2.2 GIS Integration Enhancements
2.2.1 TIN Bathymetry Assignment
Cell centre elevations can now be set using a triangulated irregular network (TIN) using the
Set Zpts == Read GRID Zpts == Read GIS Z Line == Cell Elevation File ==
The below example shows the use of
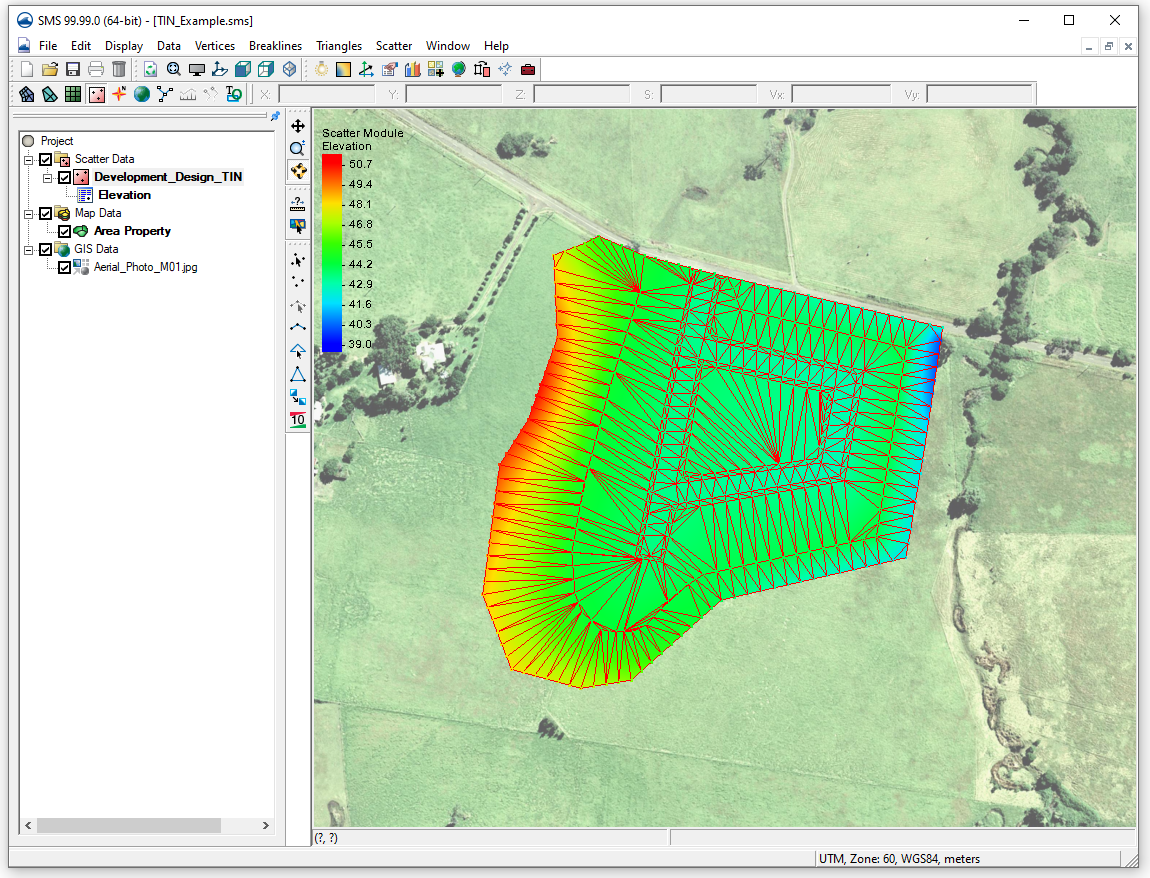
Figure 2.1: Design TIN Layout
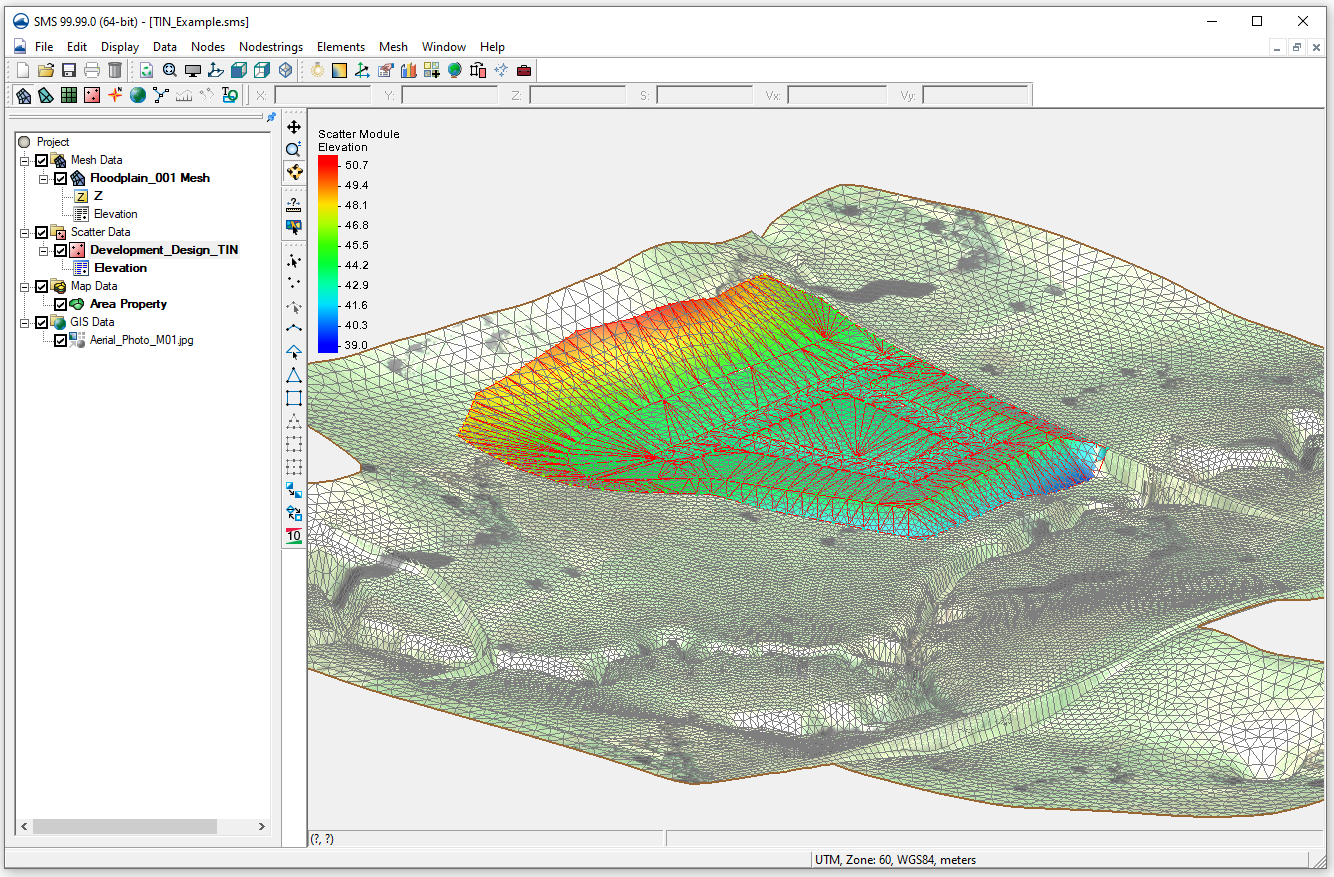
Figure 2.2: Oblique View of Design Mesh Topoography
To ‘stamp’ the development elevations onto the mesh, the TIN is specified at a position in the .fvc below the assignment of the existing topography as follows.
! GEOMETRY
If the
2.3 Hydraulic Structure Updates
2.3.1 Default Culvert Height And Width Contraction Coefficients
Culvert width contraction (Width_Cont) and height contraction (Height_Cont) coefficients have been updated to default to 1.0. Previously if the Width_Cont and Height_Cont were not explicitly set in the culvert database file, TUFLOW FV would default to 0.0 resulting in no flow through the structure.
Note:
The height contraction coefficient Height_Cont for box culverts is usually 0.6 for square edged entrances to 0.8 for rounded edges. This factor is not used and is ignored for circular culverts
The width contraction coefficient Width_Cont for box culverts typically varies from 0.9 for sharp edges to 1.0 for rounded edges. This factor is normally set to 1.0 for circular culverts.
2.3.2 Default Culvert Entry and Exit Loss Coefficients
Culvert entry loss (Entry_Loss) and exit loss (Exit_Loss) coefficients have been updated to default to 0.5 and 1.0, respectively. Previously if these parameters were set to zero in the culvert database file, TUFLOW FV would default both to 0.0. Setting these to zero now results in these new defaults being applied.
Note:
- If 0.0 is required for either of these coefficients then this can be effectively achieved by setting very small numbers in the culvert database file. Any number greater than 10\(^{-6}\) will serve this purpose.
2.3.3 Improved Culvert Invert Checking
An error message is now output if 1D culvert inverts are specified below the minimum ground elevation of connected nodestrings or zones. The default error behaviour can be set to a warning using the global .fvc command
The error/warning message is output to the TUFLOW FV log file (.log) and the GIS messages layer (located within the log directory) if GIS integration is enabled.
An example of the error message is provided below.
Downstream culvert invert elevation is 36.50000
Downstream ground elevation (minimum) is 37.50000

ERROR: Culvert downstream invert is less than ground elevation, ID 1
This warning message is provided to highlight areas where the 1D/2D connection may need improvement, or mesh elevations at the inlet or outlet of a culvert structure may need to be amended to reflect surveyed culvert invert levels.
2.4 Minor Enhancements and Fixes
2.4.1 External Turbulence Scaling
When using
Eddy viscosity = Computed eddy viscosity x Eddy viscosity scale factor
Scalar diffusivity = Computed scalar diffusivity x Scalar diffusivity scale factor
For example:
2.4.2 Depth Velocity Product Output Parameter
The product of depth and velocity is now available by invoking the map or point output parameter ‘z0’ noting:
- The 0 in z0 is a zero, not the letter O
- 2D or 3D map output is supported for NetCDF output format
- 2D output is calculated by multiplying the water depth by the depth averaged velocity
- 3D output is calculated by multiplying the water depth by the surface 3D layer velocity
- Maximum and minimum statistics tracking is supported via the
Output Statistics output block command - Depth averaged map output is available via XMDF and DATV output formats
- Point output is supported
The following two examples show the output of z0 for NetCDF and Point outputs respectively.
2.4.3 Additional Point Output Parameters Supported
The output parameters outlined in Table
2.1 are now available for point time series output. Each can be specified using the
| Point Output Parameter | Description | Units |
|---|---|---|
| BEDLOAD_SED_X | Bedload for a specific sediment fraction X | g/m/s |
| PAR | Photsynthetically active radiation - Z-face | W/m\(^2\) |
| PAR_CC | Photsynthetically active radiation - Cell-centered | W/m\(^2\) |
| RHOW | Water density | kg/m\(^3\) |
| SEDLOAD_SED_X | Sediment load for a specific sediment fraction X | g/m/s |
| SUSPLOAD_SED_X | Suspload for a specific sediment fraction X | g/m/s |
| TURBZ | Turbulence Output Parameter which includes each of the following TURBZ_ outputs. | NA |
| TURBZ_BVFSQ | Cell z-face buoyancy production (BRUNT-VAISALA) frequency squared | /s\(^2\) |
| TURBZ_EPS | Cell z-face turbulence dissipation | m\(^2\)/s\(^3\) |
| TURBZ_L | Cell z-face turbulence length-scale | m |
| TURBZ_NUH | Cell z-face vertical temperature diffusivity | m\(^2\)/s |
| TURBZ_NUM | Cell z-face vertical eddy viscosity | m\(^2\)/s |
| TURBZ_NUS | Cell z-face vertical salinity diffusivity | m\(^2\)/s |
| TURBZ_SPFSQ | Cell z-face shear production frequency squared | /s\(^2\) |
| TURBZ_TKE | Cell z-face turbulent kinetic energy | m\(^2\)/s\(^2\) |
| VMAG | Velocity magnitude | m/s |
| W | Vertical velocity | m/s |
| WVPERBOT | Wave near-bed orbital motion period | s |
| WVUBOT | Wave near-bed orbital motion amplitude | m/s |
2.4.4 Improved Boundary Nodestring Overlap Checking
TUFLOW FV will now return an error and stop a run if it detects overlap between two or more open boundary nodestrings specified across .2dm and 2d_ns GIS files.
If the model has GIS integration enabled, an entry will be added to the GIS messages layer output to the log directory. This can be reviewed in GIS (refer Figure 2.3).
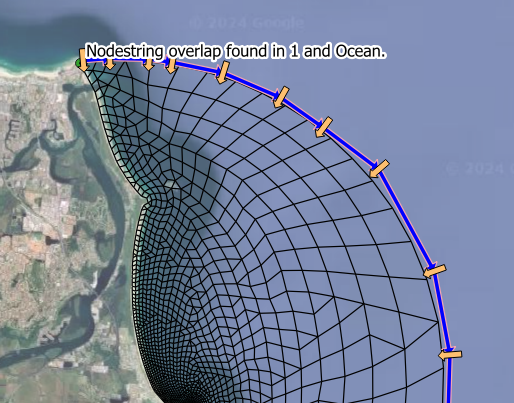
Figure 2.3: Nodestring Overlap Check
2.4.5 GPU 3D Drying Z Layer Message Fix
This fix concerns an incorrect error message for models using z or z-hybrid 3D layering on GPU hardware. CPU runs are not affected.
During simulation, if the top z-layer dried out TUFLOW FV was incorrectly reporting a water level and/or velocity magnitude exceedance message as follows.
ERROR: Water Surface and/or Velocity Magntitude has exceeded limits in cell 20
The z-layer drying error message has been fixed and the correct error is now reported. For example:
ERROR: Water Surface is less than 0.001m above top zlayer at cell 202.4.6 Duplicate Flux File Fix
A fix has been added to allow the output of multiple flux output blocks. As shown in the example below, after one flux output block has been specified, subsequent flux output blocks can be added, provided they contain the
2.4.7 Turbulence Map Output Fix
Vertical averaging of the ‘TURBZ’ map output parameter has been added for NetCDF format. Previously TUFLOW FV would exit prematurely.
The 2D output of 3D variables is achieved via the
2.4.8 Flux Output Header Fix
Flux output csv files have been updated to ensure ‘NS’ is prefixed on all flux file headings. This now supports integer and string nodestring names and provides backward compatibility for existing post-processing scripts such as MATLAB and Python time series extraction.
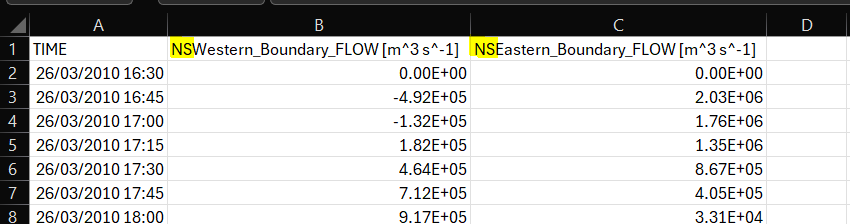
Figure 2.4: Flux Header Fix
2.4.9 Structured Mesh Check File Fix
The coordinate field width for the .2dm check file when using regular meshes has been increased to ensure coordinates are written correctly for both spherical and cartesian models. Previously, x and y coordinates were not being correctly delimited for cartesian models, leading to .2dm read errors in supporting GIS software.
